





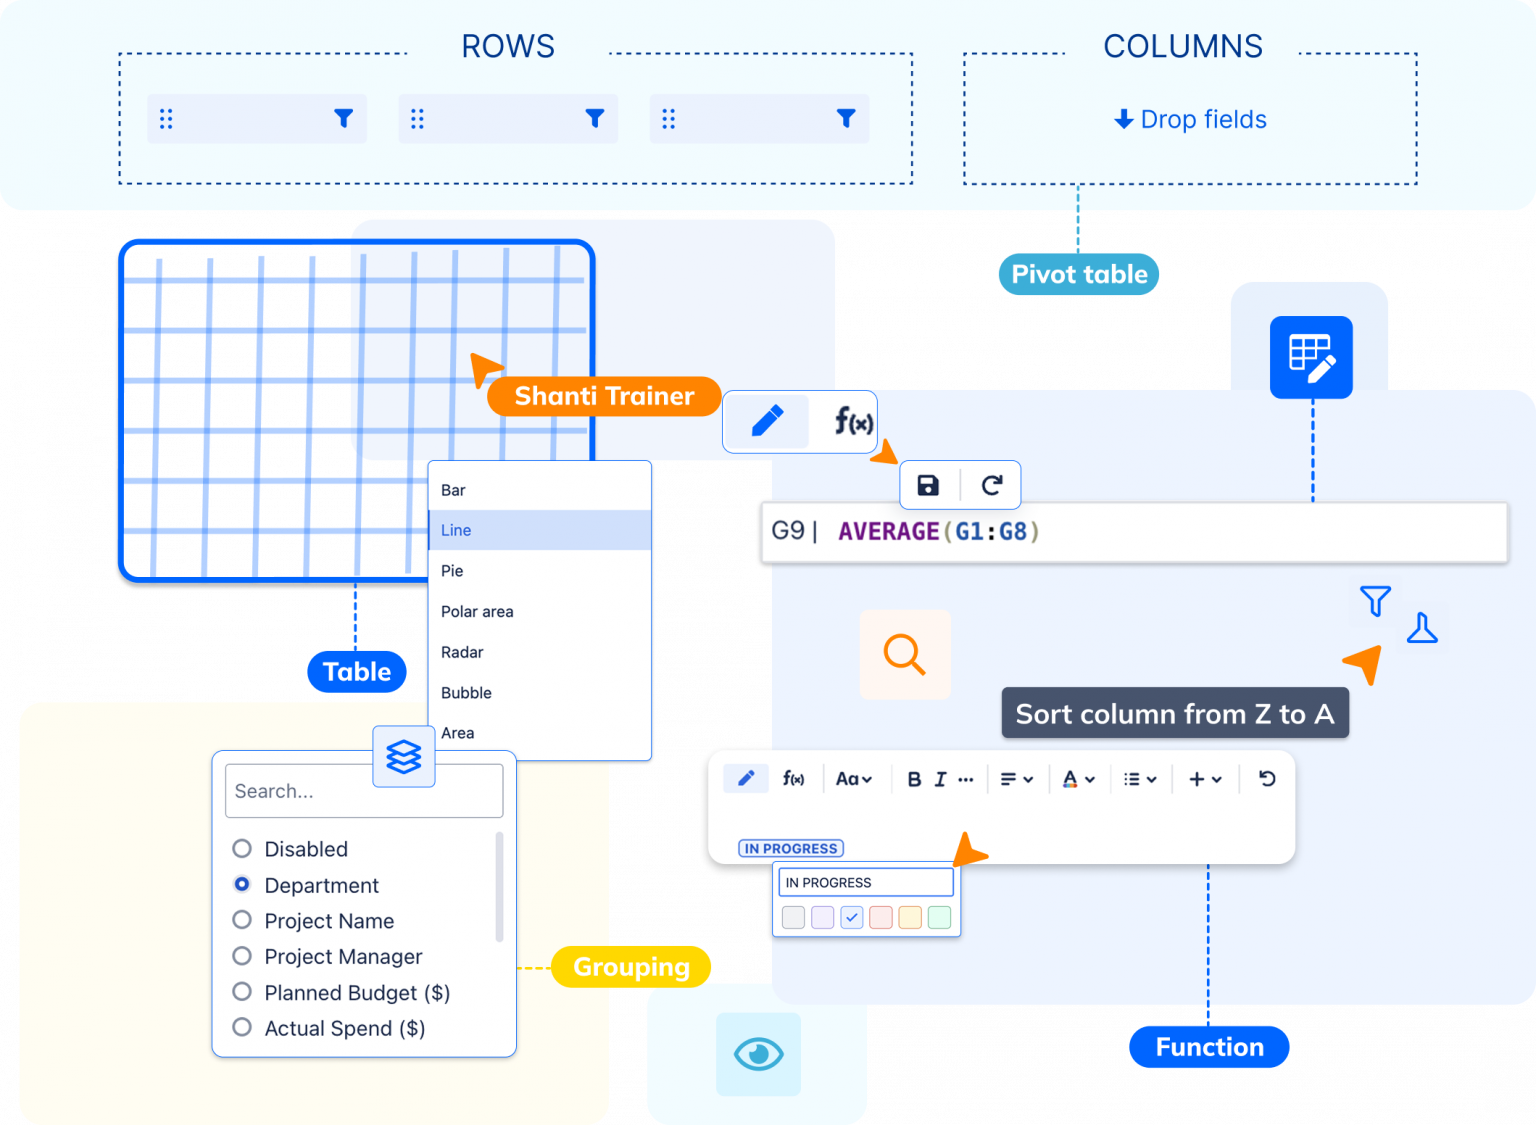

Easily enhance your Confluence tables with 390+ Excel functions, inline editing, advanced filters, and pivot tables. Perform calculations, build formulas, visualize data with charts, and collaborate in real time no extra tools required. Smart Tables for Confluence makes it interactive, dynamic, and ready for reporting.
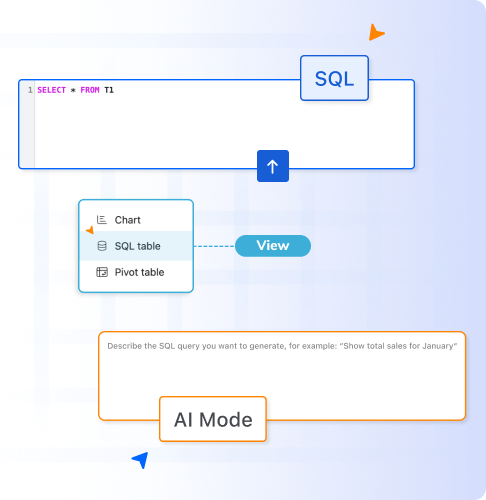
Smart Tables SQL lets you turn one table into the exact view you need. Filter, sort, group, and combine conditions without creating duplicate tables.
Write your own SQL query, or describe what you want to see and let AI generate it for you. Save different views in tabs and switch between them whenever you need.
SQL comes built into Smart Tables. No separate tool or setup required.
Explore SQLApply 390+ Excel formulas directly in your Confluence tables to calculate, convert, and summarize data.
Instantly update data within the Confluence page view using inline editing.
Filter rows and columns with advanced options text, date, number, dropdowns and more.
Generate bar, line, pie, and more charts from your data tables with responsive themes.
Quickly summarize and analyze your data, making it easier to find insights and make decisions
live editing using the Spreadsheets macro Excel-like power for Confluence.