Reporting and metrics in Smart Courses for Confluence LMS
Percentages mean analytics. Reporting and metrics are key features that you surely look for when choosing the right learning management system (LMS) for your team.
What’s the purpose of having an LMS without measuring the learners’ success? This is obviously a rhetorical question. When organizing a training session, you’re thinking of the report that should be held afterward and the evaluation you should do to decide the next step. To do that, you need a tracking system included in your LMS to track the learner’s path.
Smart Courses for Confluence LMS team did their best to deliver an optimal user experience. They provided you with 2 different stages of reporting and metrics, going from general to specific, in addition to the user profile specifications.
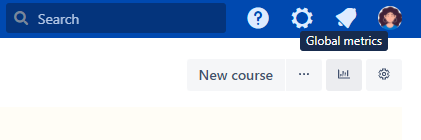
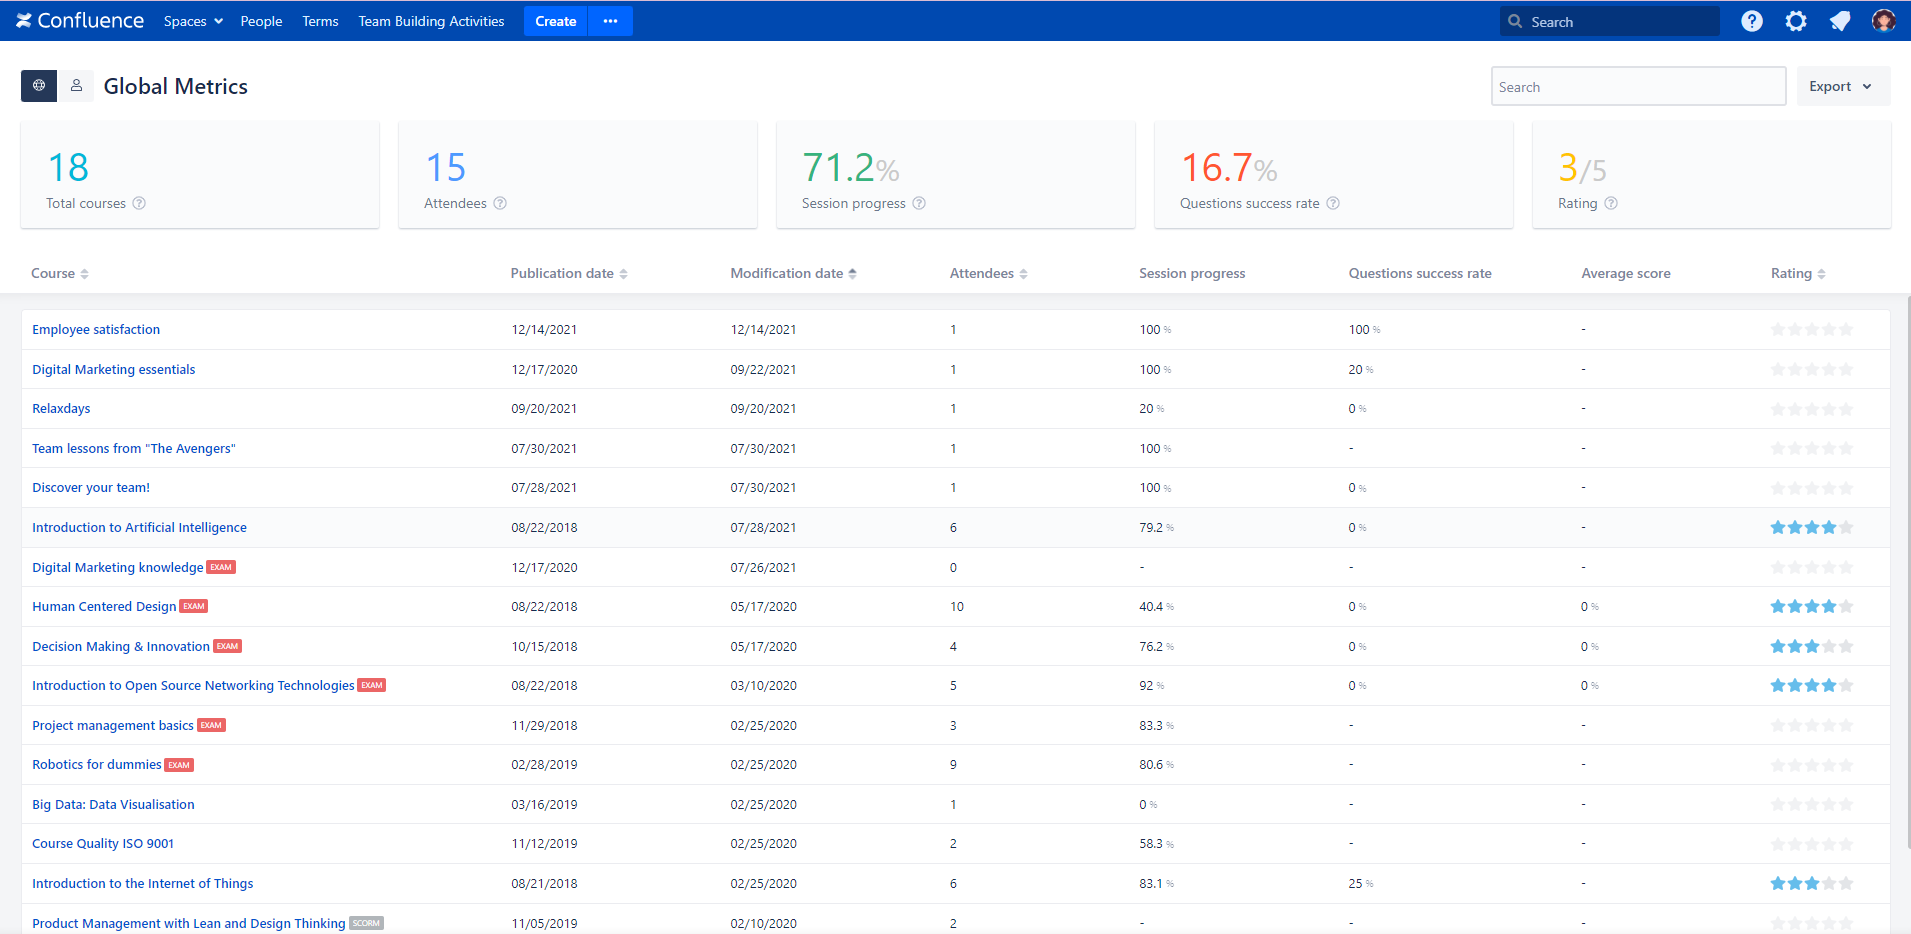
Global metrics:
Global metrics are a general measurement overview of all courses and all users. You can access them from the course catalog menu bar.
You have the average indicators shown in the page’s header, followed by the metrics grid and its list of courses.
Assuming you’re an HR manager, you need to know the session progress to have a general idea of how many capsules were visited in the courses compared to the total number. Providing courses for onboarding like the company policy or the office rules requires a high progress rate to ensure that the newbies had a look at everything. However, suppose you are an IT manager and willing to acknowledge your new team about the apps they will be developing. In that case, the course will have questions to analyze their understanding rate to know what should be worked on more in the next course. Smart Courses’ reporting and metrics section allows you to track the questions’ success rate in all courses for a specific space if you are preparing a full generalized report.
For a clear vision, you can export the results in Excel or CSV, and there you’ll have more details, and you can filter the data depending on what you need in your report.
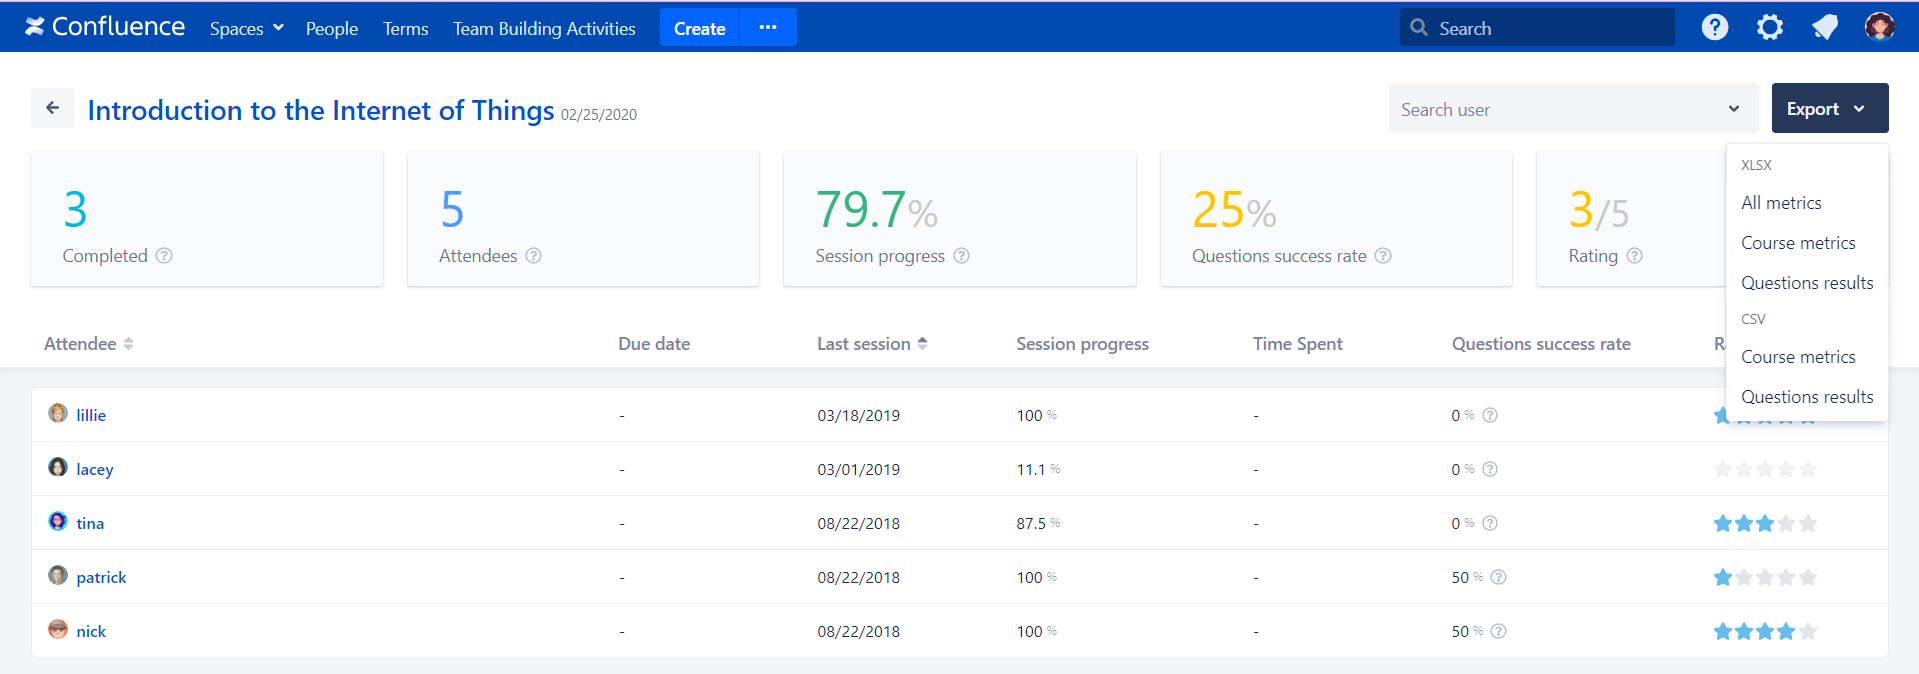
Course metrics:
If your use case is more related to tracking, reporting and metrics, Smart Courses LMS provides you with that as well. You can export the metrics in more detail with the below option.
As shown in the screenshot below, you can export all the data grid, the attendees’ data, or the questions’ details. Each on a side to have an elaborated report.
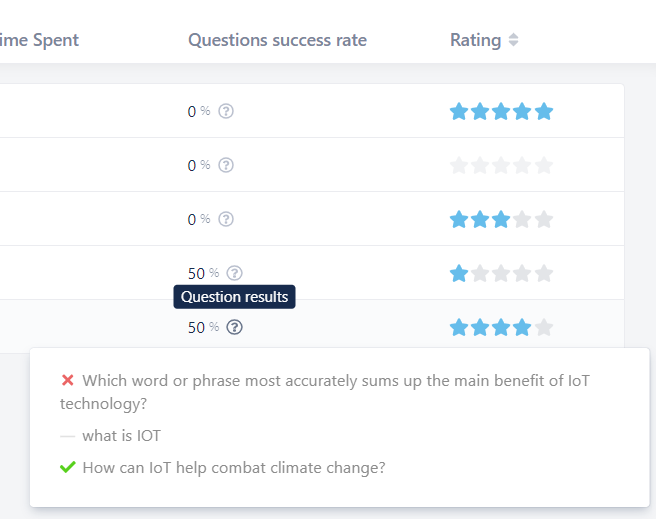
To have an overview of the correct and wrong answers of the team, you can click on the question mark of the attendee in the question success rate section, and you’ll get this.
The ❌ mark indicates that the question was answered incorrectly.
The ━ symbol presents the skipped questions.
The ✔ icon shows that the question was resolved correctly.
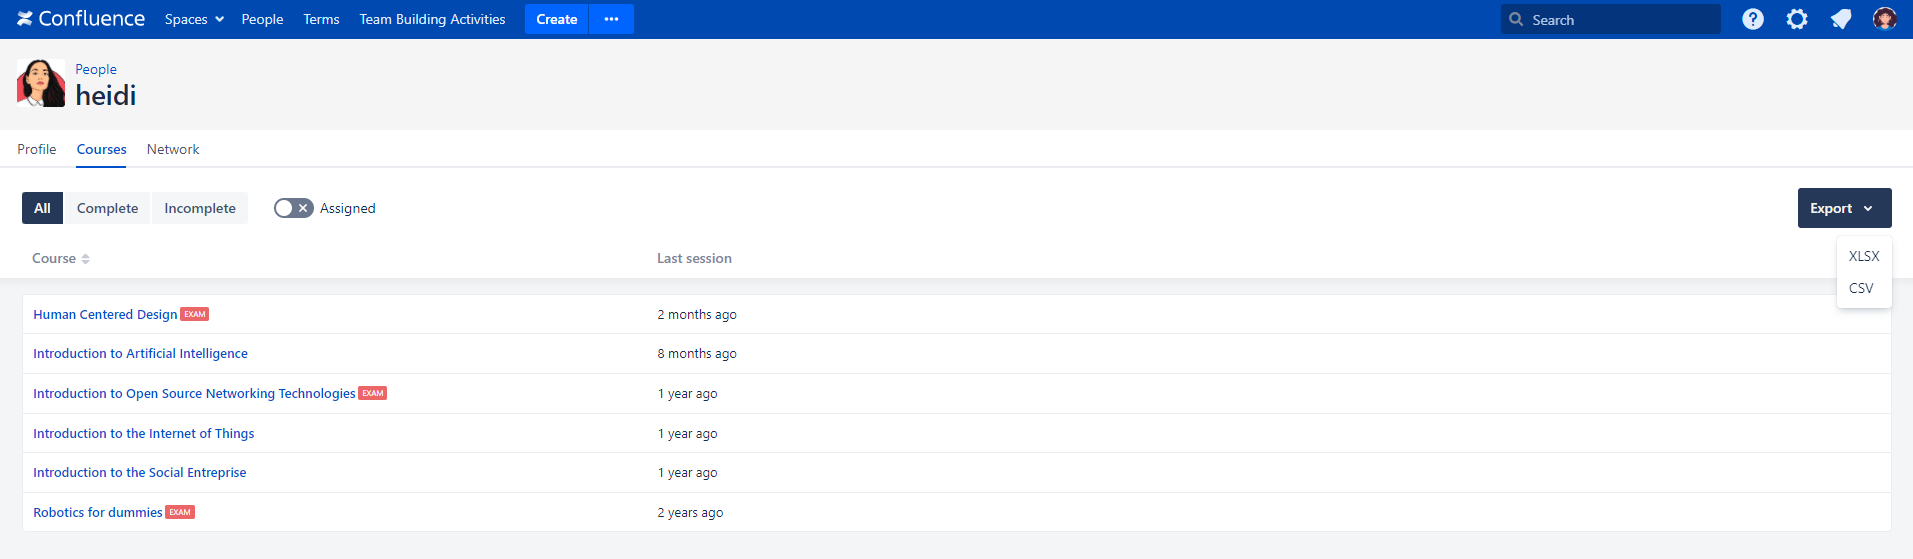
Courses per-user
The profile shows you all the courses done by that user, the complete ones, the incomplete, and the assigned ones. You can track your team’s activity by browsing their profile.