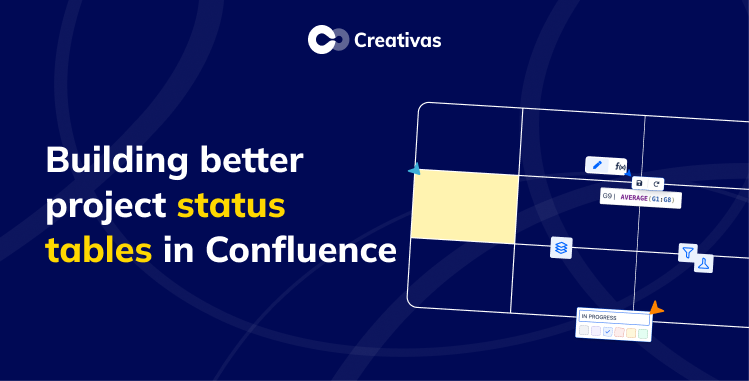
Building better project status tables in Confluence
Every program manager has built the same page, a Confluence table with one row per project status, columns for owner, team, phase, RAG status, and last updated date. It looks exactly like a status view. The first week, it works.
By week three, three projects still say “In Progress” from a month ago. The “Last Updated” column hasn’t been touched. Someone added a new project at the bottom without following the format.
And in the next portfolio review, the first five minutes are spent asking whether the page is even accurate.
The problem is not that people forgot to update it. The problem is that the native Confluence table was never built to function as a live project view. It’s a static document dressed up to look like one.
Why do native Confluence tables fail as status tracking tools?
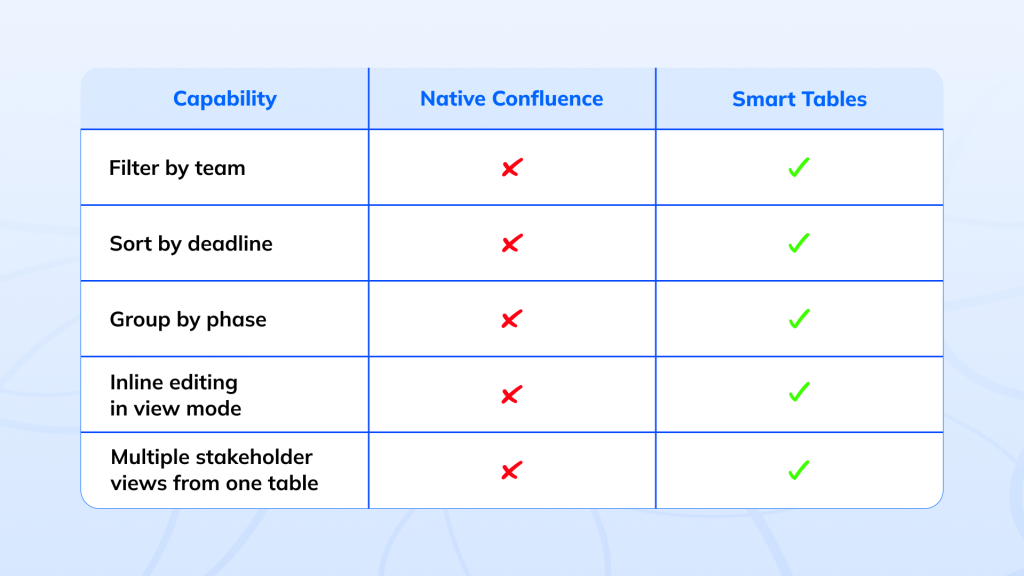
Some teams use Page Properties Reports to create portfolio views. Others rely on large native Confluence tables. Both approaches can work, but as the number of projects grows, filtering, sorting, updating, and maintaining multiple stakeholder views becomes increasingly difficult.
On Confluence Cloud specifically, the Page Properties Report exists in a stripped-down form called the Content Properties Report. Macro nesting isn’t supported, which breaks the more advanced configurations that work on the Data Center. Cloud teams are largely left with a plain native table, and the limitations compound fast.
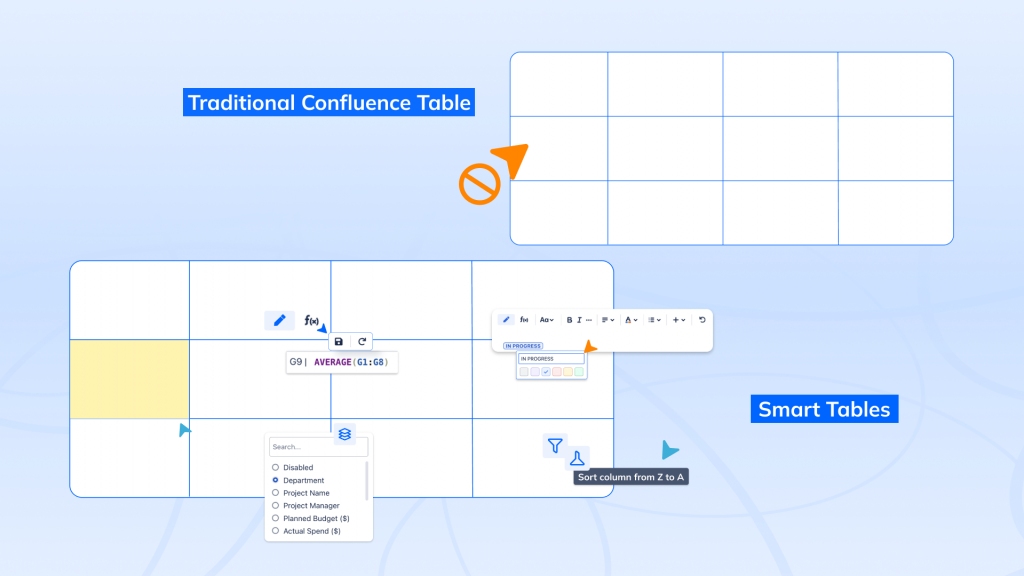
There’s no way to filter by team or RAG status in view mode, no sorting by deadline or priority, and no grouping by phase. The table shows everything to everyone, which, for a portfolio of 15 or more projects, usually means it shows too much to be useful.
All your projects, one table
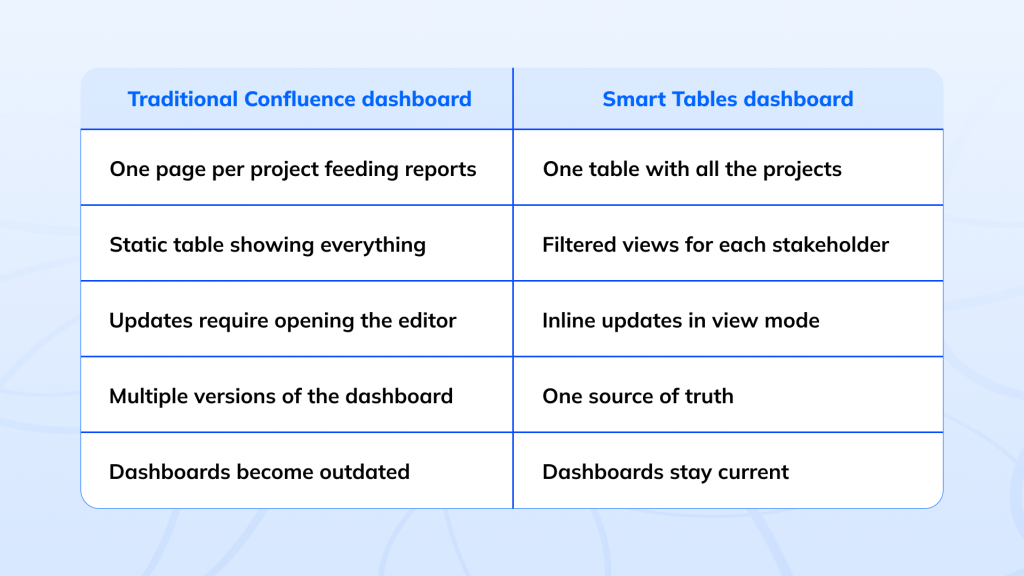
Smart Tables for Confluence (Table Filter & Charts) approaches the problem differently. Instead of spreading project information across multiple pages and reports, it keeps everything in a single structured table and adds the interactivity needed to manage it effectively.
One row per project, all data in one place, different stakeholders interact with that same data in different ways without creating additional pages, exports, or versions.
Some of these capabilities are available in other Confluence content formats: inline editing in Live Docs and filtering in Databases.
RAG status that you can actually act on
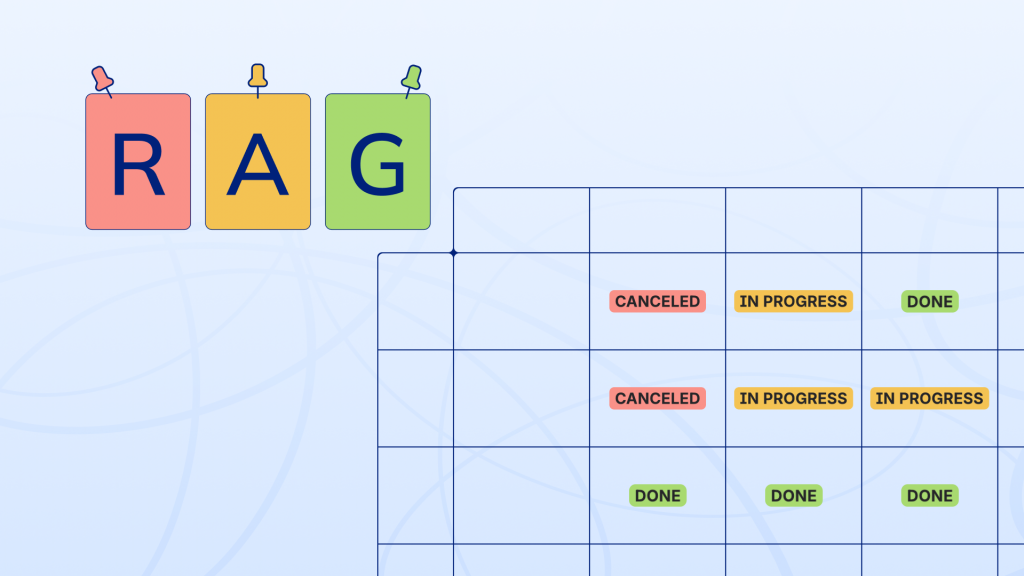
RAG stands for Red, Amber, Green, a simple health indicator that tells stakeholders at a glance whether a project is on track, at risk, or off track and in need of immediate attention. It’s the first thing anyone looks for in a portfolio review, and the first thing that becomes meaningless when a Confluence native table goes stale.
From there, the whole table responds.
Filter to show only Red and Amber projects before a steering committee meeting and sort by RAG status to surface risk at the top.
Group by status to get an instant count of how many projects are on track versus struggling.
The RAG column stops being a label someone remembered to update and becomes a filter you can query.
Grouping and sorting your portfolio view
As portfolios grow, flat lists become difficult to interpret. Grouping reorganizes the same table instantly by owner to understand workload distribution, by phase to see where projects are concentrated, or by priority to surface what needs immediate attention.
The data stays unchanged; only the view does.
Before a portfolio review, sorting delivers the same speed: by deadline to bring upcoming work to the top, by RAG status to lead with risk, or by last updated date to catch stale projects before they become reporting issues.
Inline editing directly on the page
The biggest reason Confluence tables become outdated is friction. If updating a project requires opening the editor, locating the correct row, making the change, and saving the page, the update gets delayed. And delayed updates compound until the table is no longer trusted.
With Smart Tables, updates happen directly in view mode. A project manager changes the status during a standup. A delivery lead updates a phase during progress review. Small updates take seconds, so they actually happen, and the Confluence table stays current.
Jira remains the right home for tracking work items and operational reporting, but project context, stakeholder updates, and strategic notes live in Confluence, and Smart Tables for Confluence (Table Filter & Charts) make that page interactive enough to serve as the portfolio view too, no switching tools required.
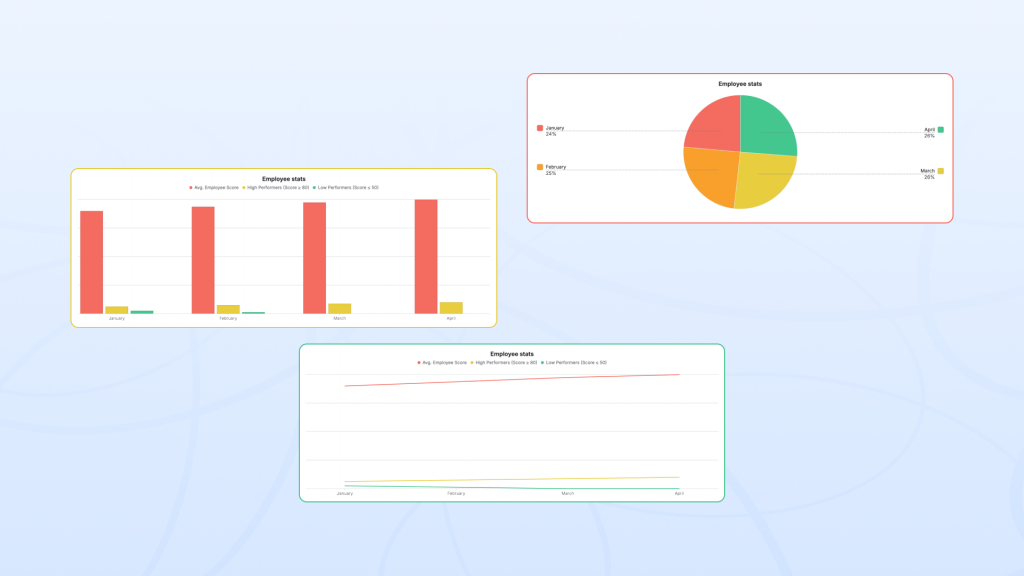
Visualize portfolio health
Smart Tables can also generate charts directly inside Confluence from the same project table, no export, no separate reporting tool needed.
A program manager can visualize projects by phase to see where the portfolio is concentrated.
A department head can view workload distribution across teams; an executive can pull up a RAG status breakdown of how many projects are Green, Amber, or Red as a chart alongside the table, ready for a board update. The chart updates automatically as the underlying data changes, so it always reflects the portfolio’s current state.
It stays connected to the rest of the page
A program manager opens the Confluence table before a portfolio review and sorts by RAG status. Every Red project appears first. An engineering lead filters to their team and groups by phase within seconds; they can see what’s in delivery and what’s still in planning. An executive opens the same page and sorts by priority to focus on the highest-impact initiatives.
Smart Tables also work naturally alongside the rest of a project page: Jira issue embeds, smart links, user mentions, decisions, and other Confluence content, the table remains connected to the broader project context rather than becoming a separate reporting destination.
The best project status table is not the one with the most metrics; it’s the one people actually keep up to date. When filtering, sorting, grouping, and editing are frictionless, the Confluence table stops being documentation and starts becoming an operational tool teams trust.
Building a project status table in Confluence that actually stays up to date is not a process problem. It’s a tooling problem, and one structured, filterable, inline-editable table is usually all it takes to solve it.
Smart Tables makes RAG status a live, actionable column rather than a static label. Project managers can update a status directly on the page in view mode no editor, no save cycle. From there, the table responds by filtering to show only Red and Amber projects, sorting by RAG to surface risk first, or grouping by status to see portfolio health at a glance. The entire table responds to the RAG column rather than just displaying it.
Smart Tables enable inline editing directly in view mode. Team members can click a cell and update it on the spot depending on permissions: a status change during a standup, a phase update mid-review. The change saves immediately and is visible to everyone. Because the update takes seconds rather than a workflow, it actually happens which is why Confluence tables on Smart Tables stay current while native tables go stale.
Instead of maintaining separate pages for each team or audience, Smart Tables lets everyone work from a single source table. Each person applies their own filters and grouping in view mode: an engineering lead filters to their team, an executive sorts by priority, and a program manager groups by phase without affecting anyone else’s view or duplicating the underlying data.