Choose the right table filter app for your Confluence pages
Tables are a core part of Confluence pages: for reporting, tracking, dashboards, and structured content. But native Confluence tables are static; you can’t filter, calculate, or dynamically manipulate them. That’s why many Atlassian users turn to marketplace apps. In this article, we benchmark Smart Tables for Confluence (by Creativas), Table Filter, Charts & Spreadsheets (by Stiltsoft) and Aura Table Filter (by Appanvil) to see which gives the best combination of power, usability, and flexibility.
We’ll walk through methodology, side-by-side results, pros/cons, use-case recommendations, and a verdict. The goal: help Confluence users and decision-makers (especially those evaluating switching or upgrades) choose wisely.
Methodology & Benchmark Criteria
To make this comparison fair and meaningful, we defined the following criteria and approach:
| Criteria | Measurement Approach | Why It Matters |
|---|---|---|
| Feature completeness | Does the plugin support filtering, sorting, calculations, pivot, charts, macros, import/export, collaborative editing, etc. (based on vendor docs and hands-on testing) | Users expect a “table solution” to do more than static tables |
| Usability & UX | Ease of converting from a Confluence table, inline editing, configuration complexity, and visual clarity | If it’s powerful but hard to use, adoption suffers |
| Interactivity & real-time editing | Ability to collaborate live (edits in view mode), filter state persistence, macro interactivity | For teams working together, these features are crucial |
| Integration & extensibility | Ability to import/export. | Users often combine multiple tools; flexibility is key |
| Documentation & support | Quality of help docs, tutorials, and marketplace partner support responsiveness | Even powerful tools fail without good support |
Test setup & process
To ensure a fair and comprehensive evaluation, we created identical test tables and converted or wrapped them within each plugin. We then performed a series of common data-management tasks such as applying multiple filters, sorting by several columns, adding formulas (SUM, IF…), building pivots, exporting to CSV and PDF, and reverting changes. Throughout the process, we recorded errors, and noted points of friction that could impact the user experience.
To validate our findings, we also cross-checked vendor documentation, user reviews, and community feedback. The results below present a detailed comparison of each tool, complete with insights, commentary, and direct links to supporting documentation.
A full comparison: Smart Tables vs Table Filter vs Aura Table Filter
Below is a comparison table summarizing feature support (✓ = supported, ✗ = not supported).
Tables main features
| Features | Smart Tables | Table Filter | Aura Table Filter |
|---|---|---|---|
| Live edit in Confluence pages | ✅ | ❌ | ❌ |
| Consistent filtering | ✅ | ✅ | ✅ |
| Calculations & excel like functions | ✅ Smart Tables supported functions | ✅ (Supports only 5 formulas for calculating columns and only 7 formulas for calculating rows) | ❌ |
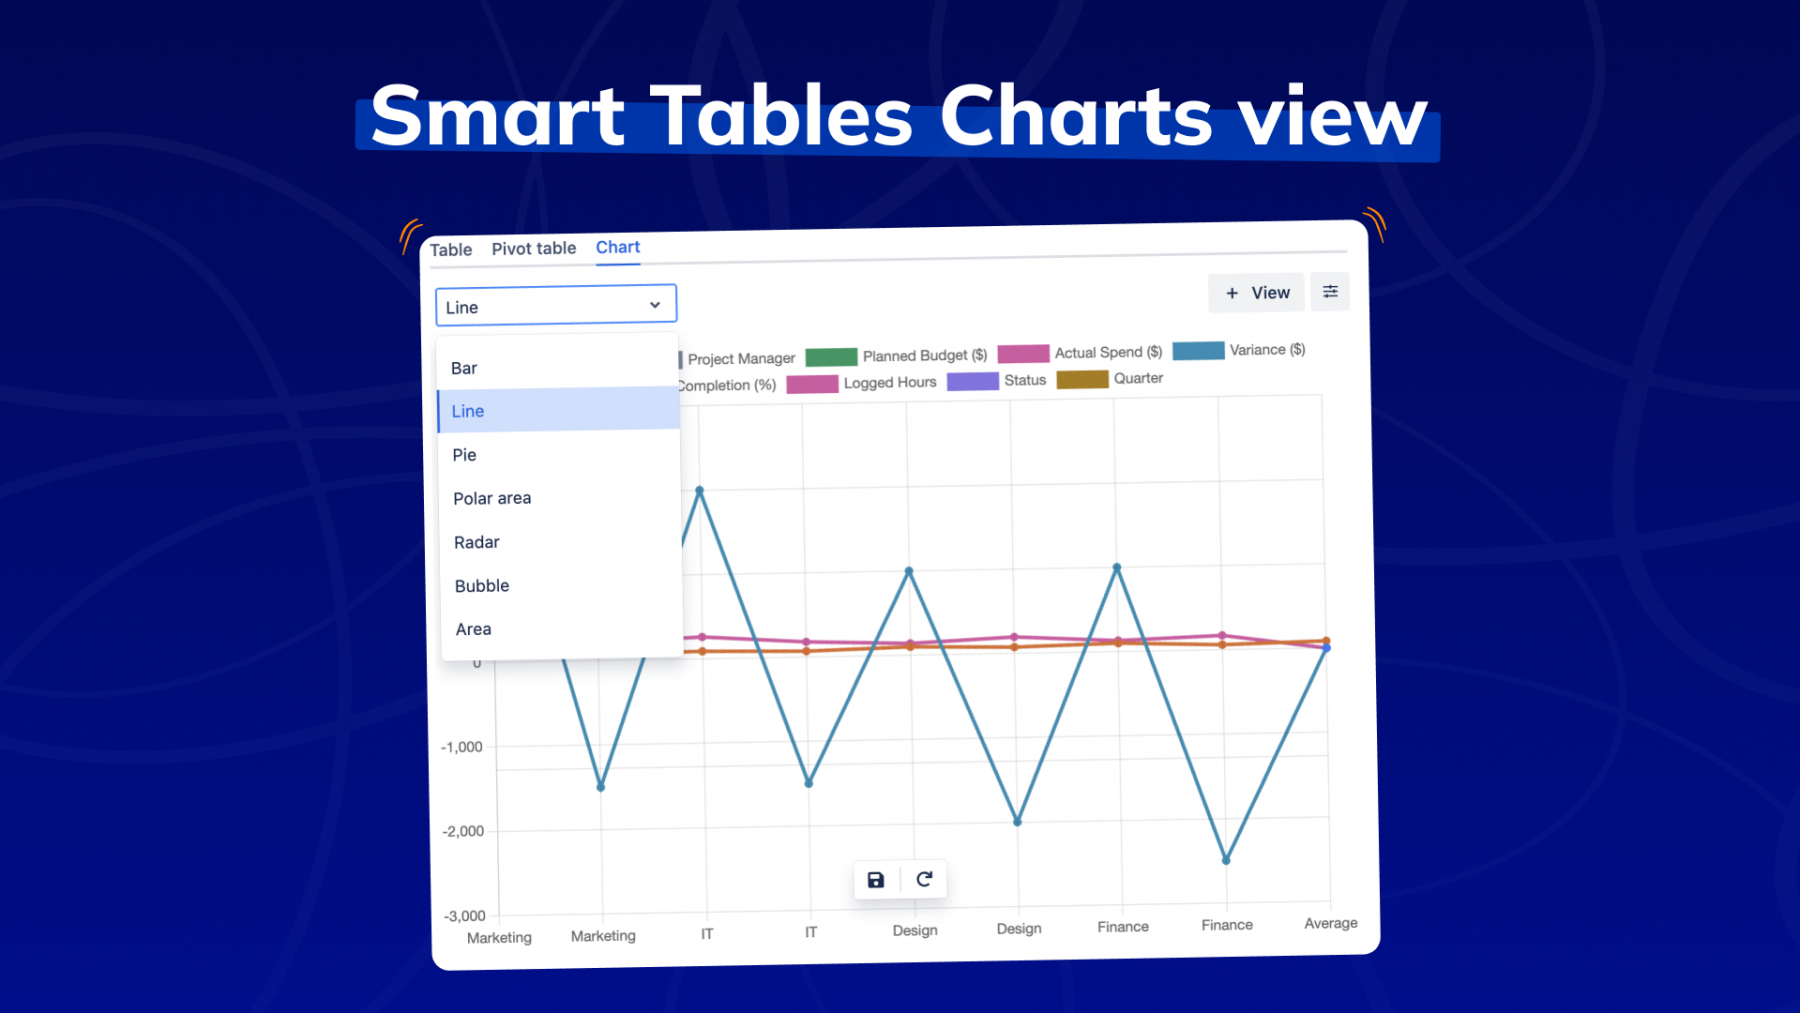
| Charts | ✅ (7 chart types, 4 themes, labels) | ✅ (15 chart types, Appearance, themes) | ✅ (Less configuration and customizations) |
| Pivot tables | ✅ | ✅ | ❌ |
| SQL queries | Coming soon | ✅ | ❌ |
| Spreadsheets macro | ✅ | ✅ | ❌ |
| Collaborative editing in Spreadsheet | ✅ | ❌ | ❌ |
| Convert Confluence tables into spreadsheet | ❌ | ✅ | ❌ |
| Sorting | ✅ | ✅ | ✅ |
| Grouping | ✅ | ❌ | ✅ |
| Search in the entire table | ✅ | ❌ | ✅ |
| Sample table | ✅ | ❌ | ✅ |
| Revert to Confluence table | ✅ | ✅ | ❌ |
| Export table | ✅ (XLSX, CSV, Word, PDF) | ✅ (CSV, Word, PDF) | ✅ (CSV, Word, PDF) |
| Import table | ✅ (XLSX, CSV) | ✅ (CSV, JSON) | ❌ |
| Tabs mode | ✅ | ❌ | ✅ |
| Pagination | ❌ | ✅ | ❌ |
| Support | ✅ (For every subscription) | ✅ (Premium support for advanced plans) | ✅ (Only for pro plan) |
Native Confluence macro support
| Macro/App | Smart Tables ( Creativas) | Table Filter & Spreadsheets (Stiltsoft) | Aura (Appanvil) |
| Support Atlassian smart links (Confluence page, Jira ticket) | ✅ | ✅ | ❌ |
| Support external smart links | ✅ | ❌ | ❌ |
| Table respects the Confluence page width and does not exceed it when media files are used | ✅ | ✅ | ❌ |
| Display attachments and media files in the page viewer | ✅ | ✅ | ❌ |
| View attached files right from the page viewer | ✅ | ❌ | ❌ |
| Faithful Confluence page PDF export style | ✅ | ✅ (Wide media files cause the table to be cropped) | ❌(Does not support macros) |
| Support expand macro | ✅ | ✅ | ❌(Macro titles and buttons are not visible) |
| Support quotes | ✅ | ✅ | ❌(Displays only the text) |
| Support code snippets | ✅ | ✅ (The native line numbering is removed) | ❌(Displays only the text) |
| Support Decision macro | ✅ | ❌ | ❌ |
| Clicking the mentioned username directs you to their profile | ✅ | ✅ | ❌ |
| Interaction with Action item macro | ✅ | ✅ | ❌(Cannot be selected) |
| Support Info panel macro | ✅ | ✅ (Except the note panel) | ❌ |
Keynotes & observations
Each of the evaluated Confluence table apps brings its own strengths and focus areas, offering different approaches to data management and collaboration within Confluence.
- Smart Tables for Confluence delivers a modern experience with strong performance, intuitive design, and advanced features like global search, sorting, grouping, and import/export. Its seamless integration with Smart Links, Live Docs, and mentions makes it a solid choice for teams seeking a complete, collaborative solution.
- Table Filter by Stiltsoft remains a well-established and reliable tool, offering comprehensive filtering and pivot functionality. While its interface feels more traditional, it continues to serve teams that value stability and proven analytical capabilities.
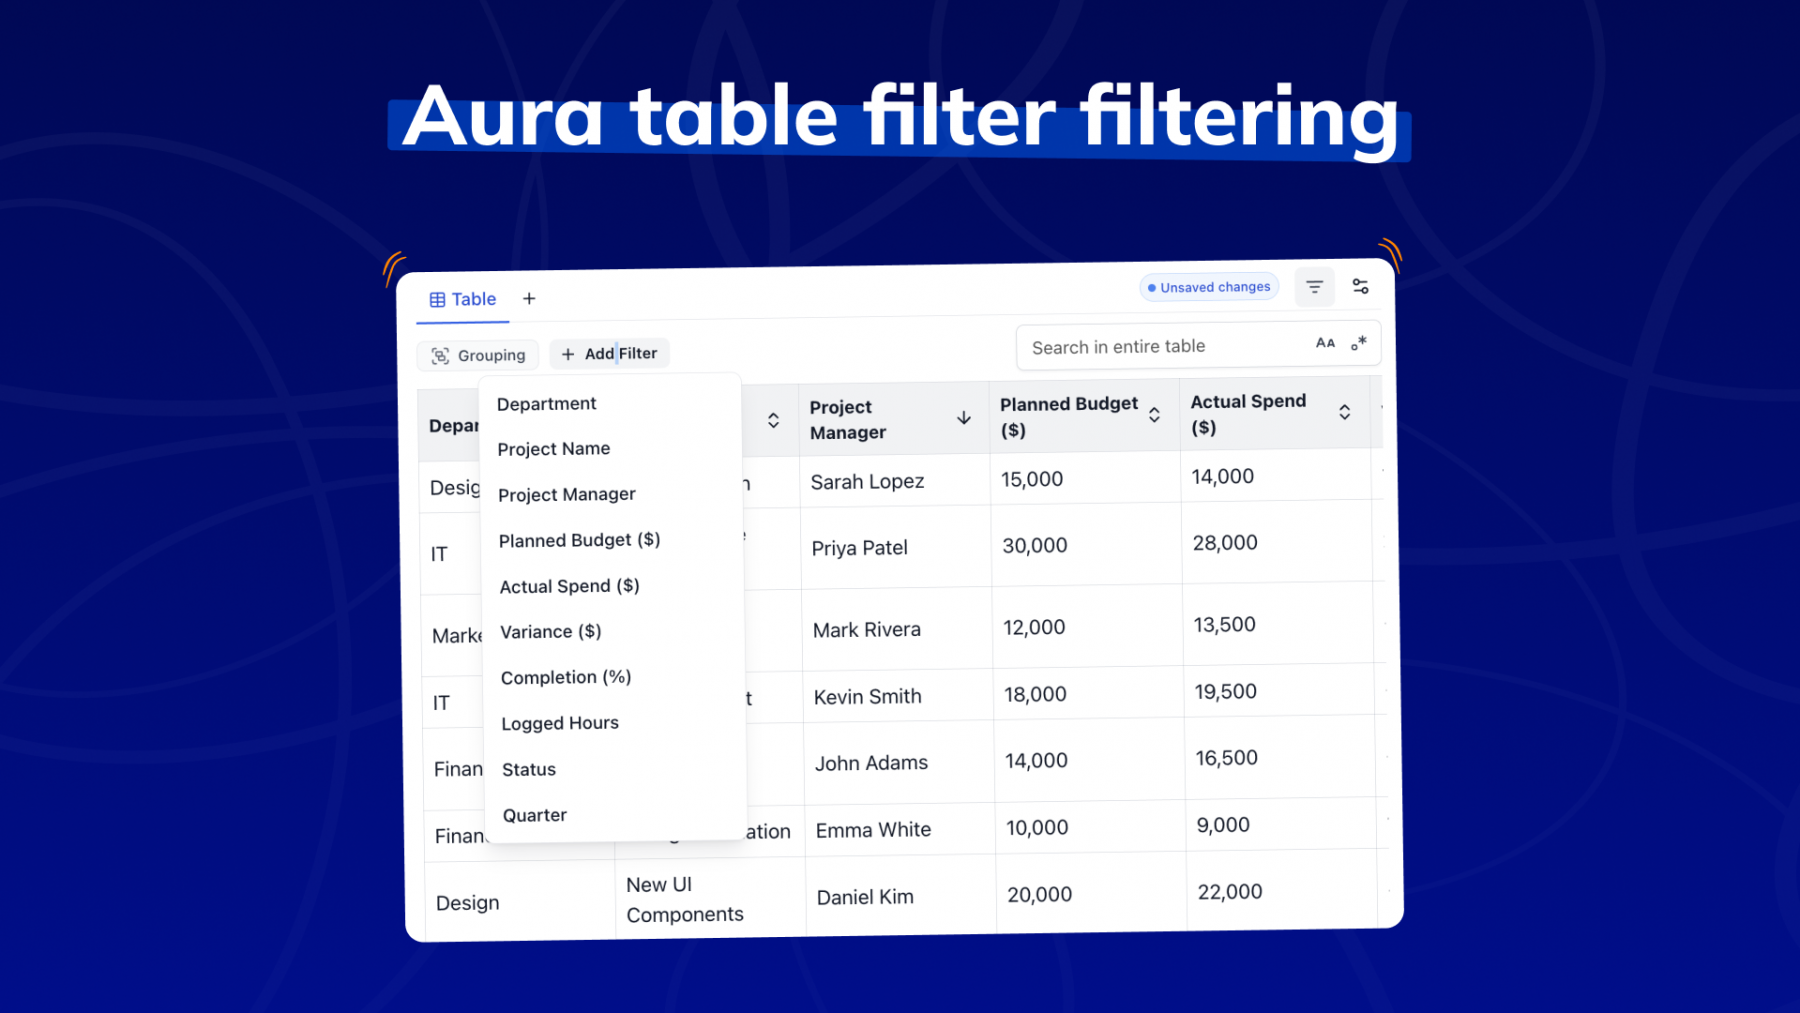
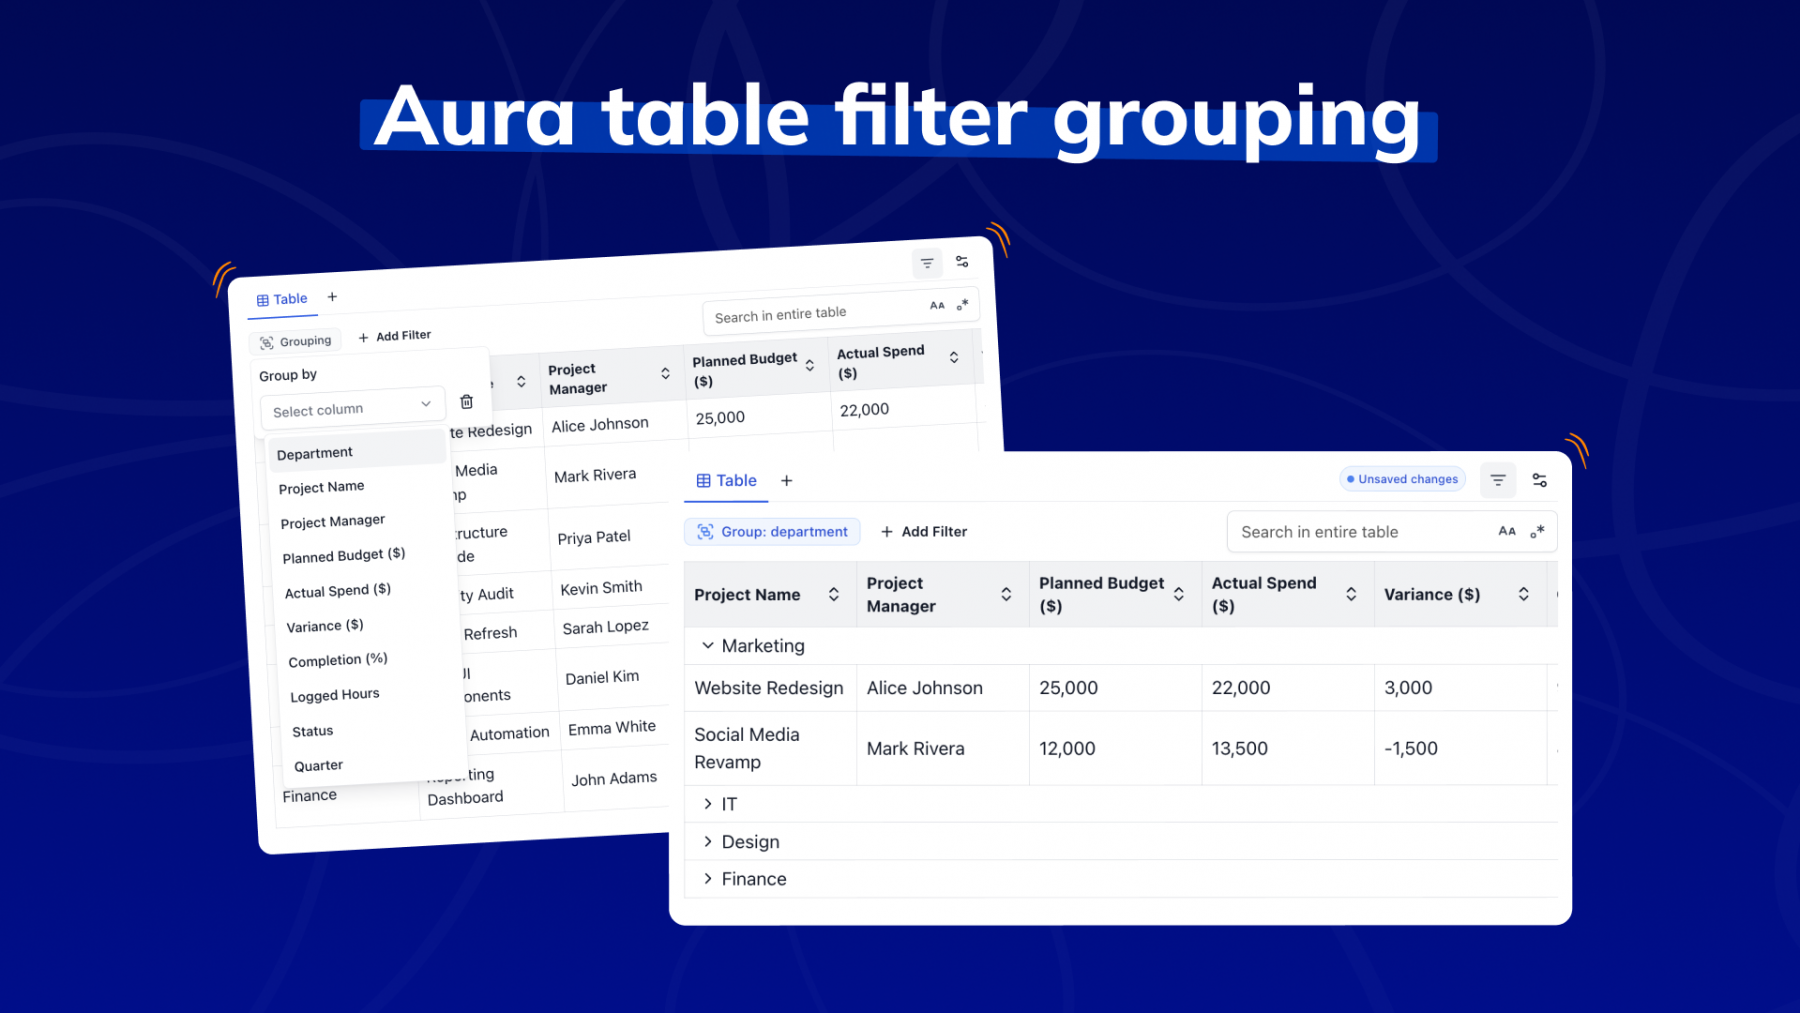
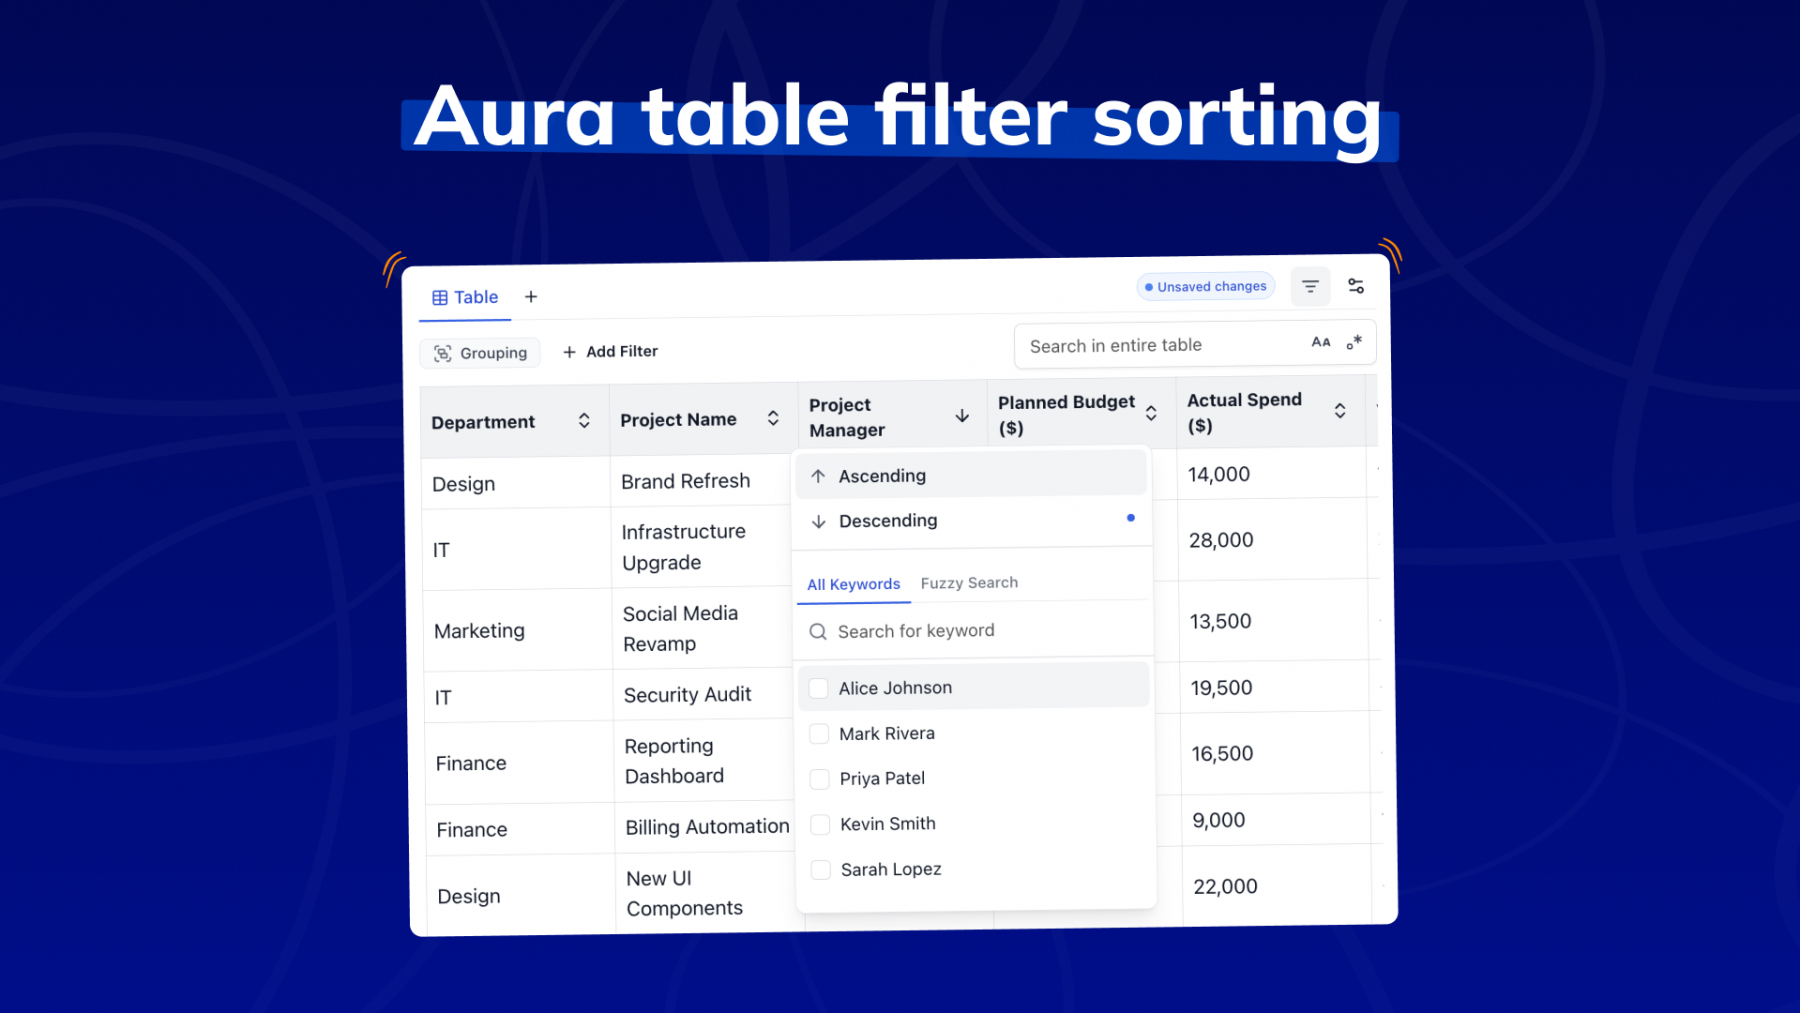
- Aura Table Filter for Confluence focuses on simplicity and visual presentation. It offers core filtering and sorting options, making it a great fit for teams that prioritize page design and readability over advanced data manipulation.
- Support, documentation, and community involvement matter greatly when users bump into issues. Creativas, Stiltsoft, and Appanvil are active on the Atlassian community and provide tutorial resources.
In the end, all three tools address different needs, from analytical power to visual clarity, allowing teams to choose the solution that best aligns with their workflows and goals.
Usecase: Project Management with Confluence
A project management team maintains a quarterly performance report in Confluence. The report includes multiple tables summarizing:
- Project timelines and completion rates
- Team workloads and logged hours
- Budget vs. actual spend per department
The team needs to combine data from several pages, perform calculations, and group information by department to prepare a shareable PDF report for leadership.
However, native Confluence tables make this process time-consuming and inconsistent; formulas aren’t supported, data formatting often breaks during export, and preserving Atlassian’s macro design in exports is unreliable while using some marketplace apps for Confluence tables.
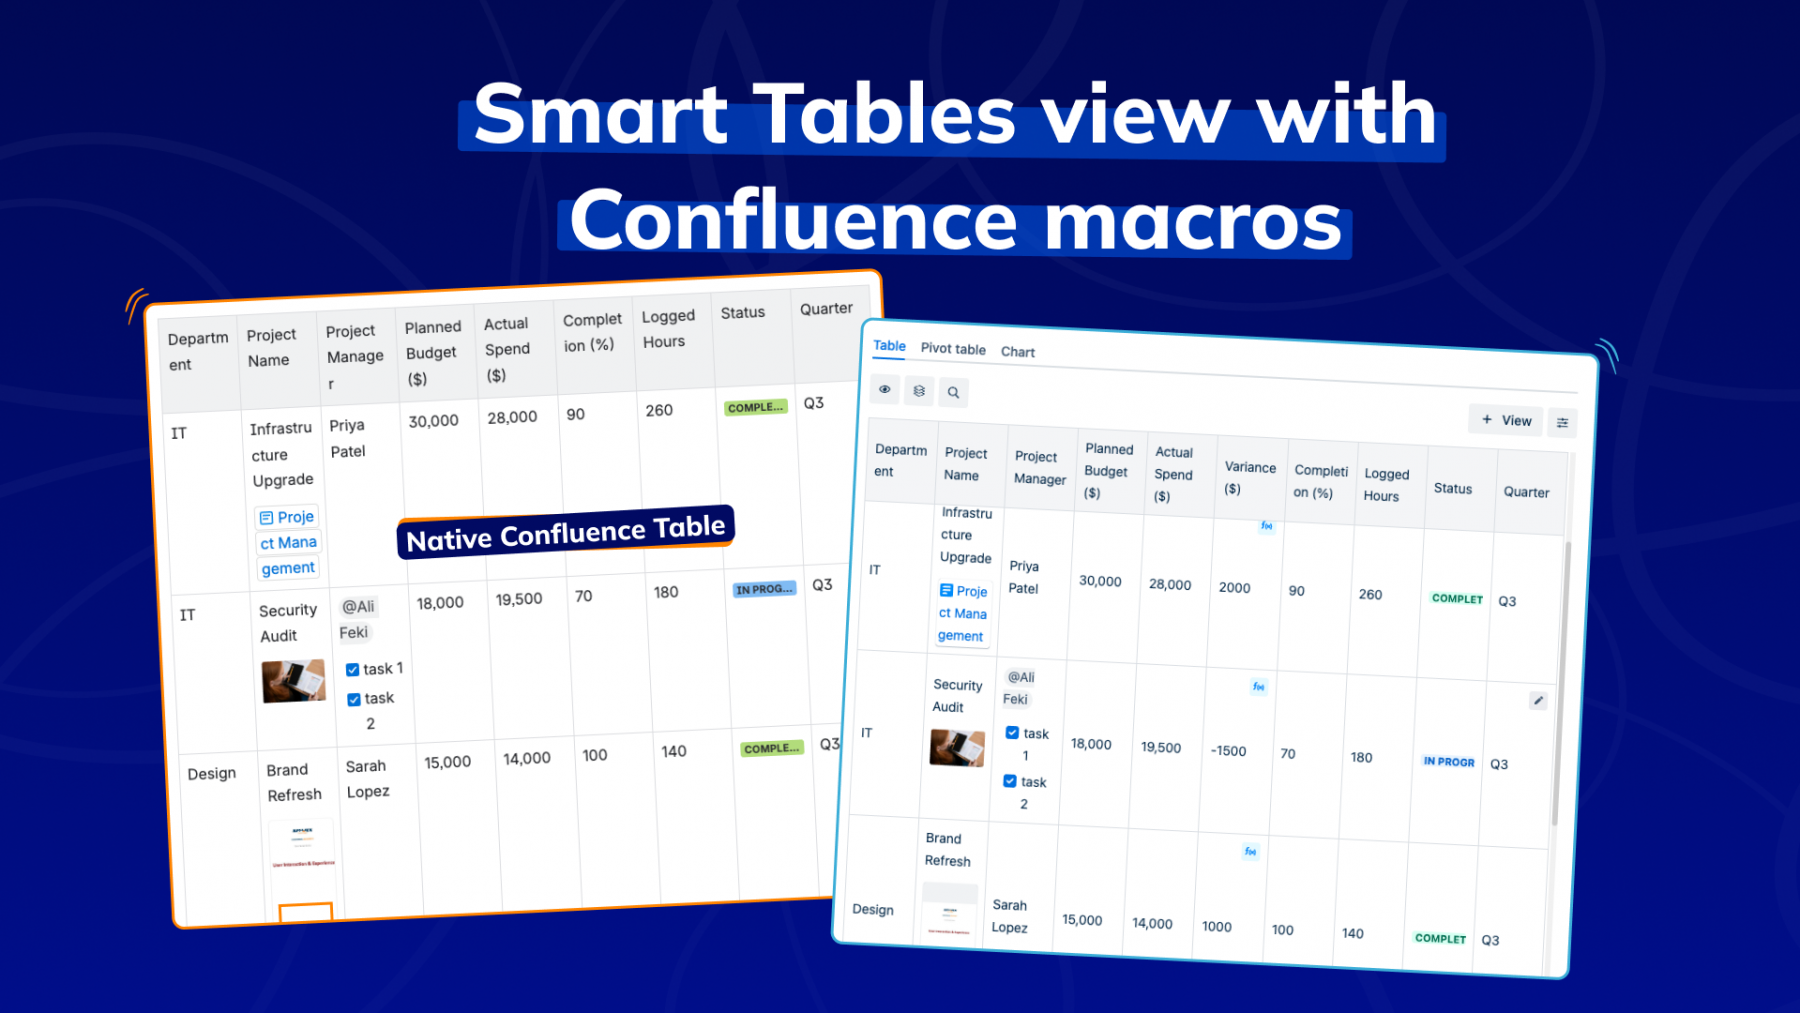
Solution with Smart Tables
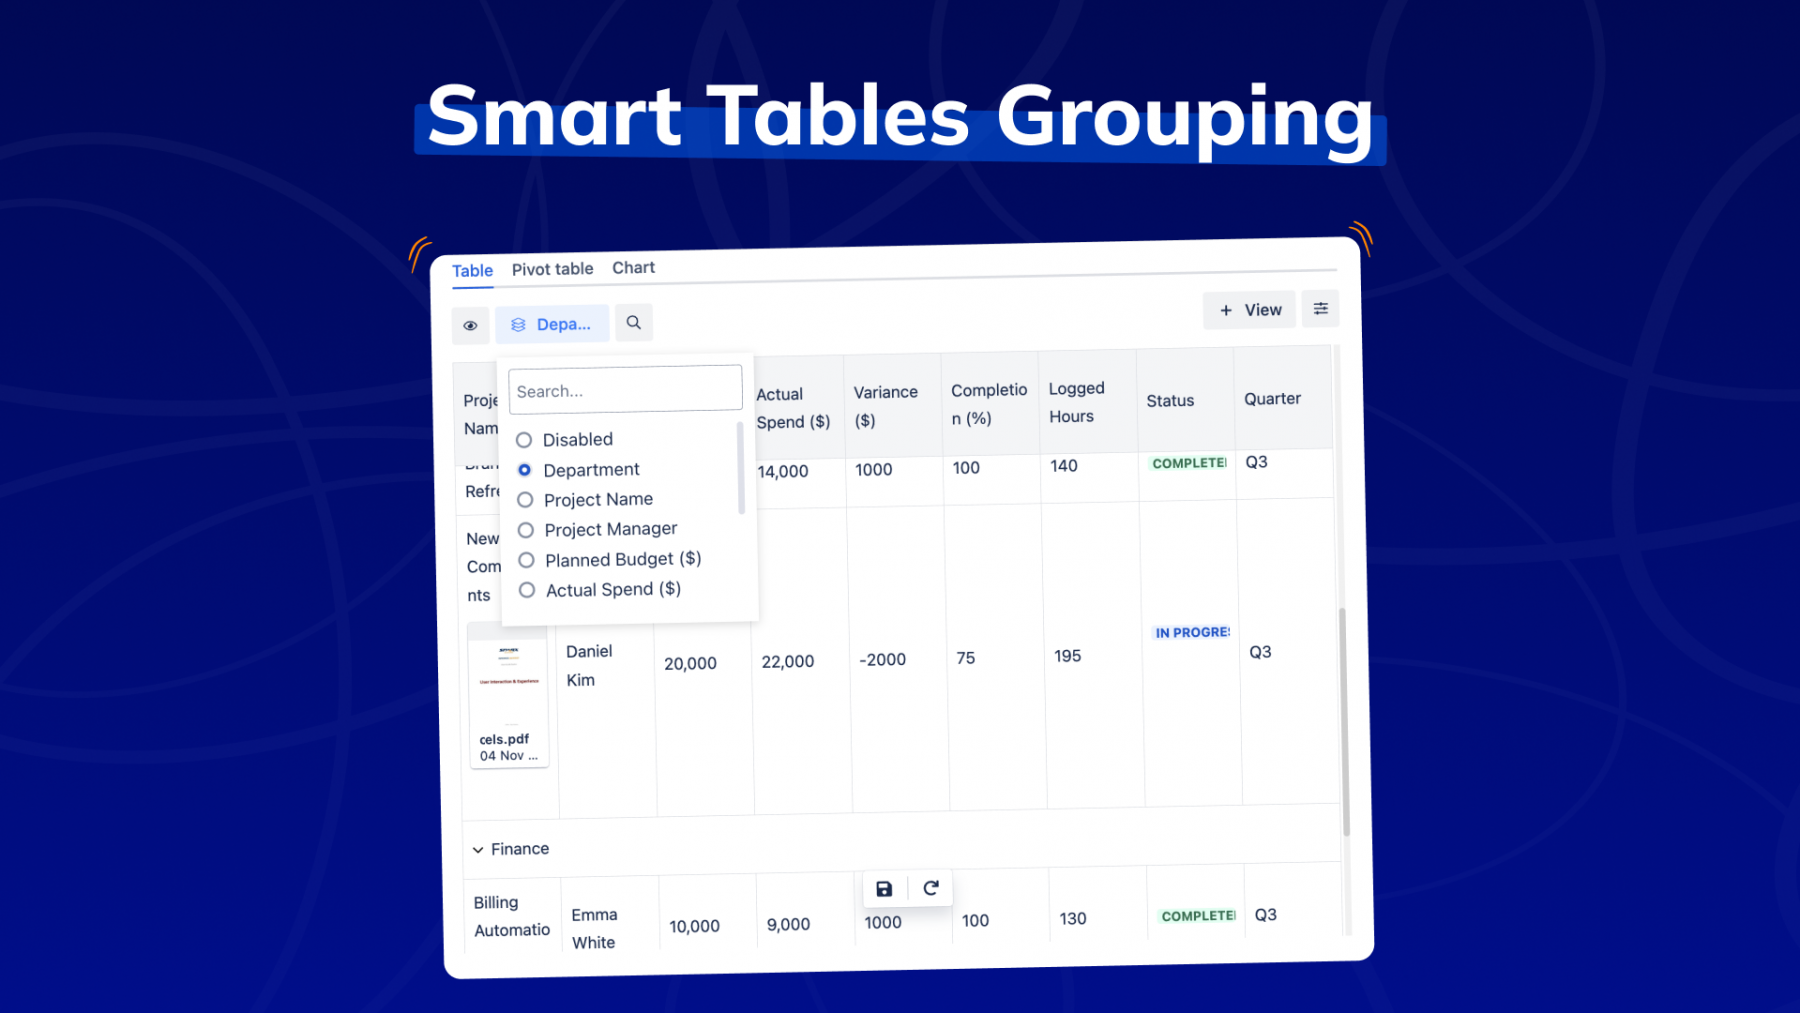
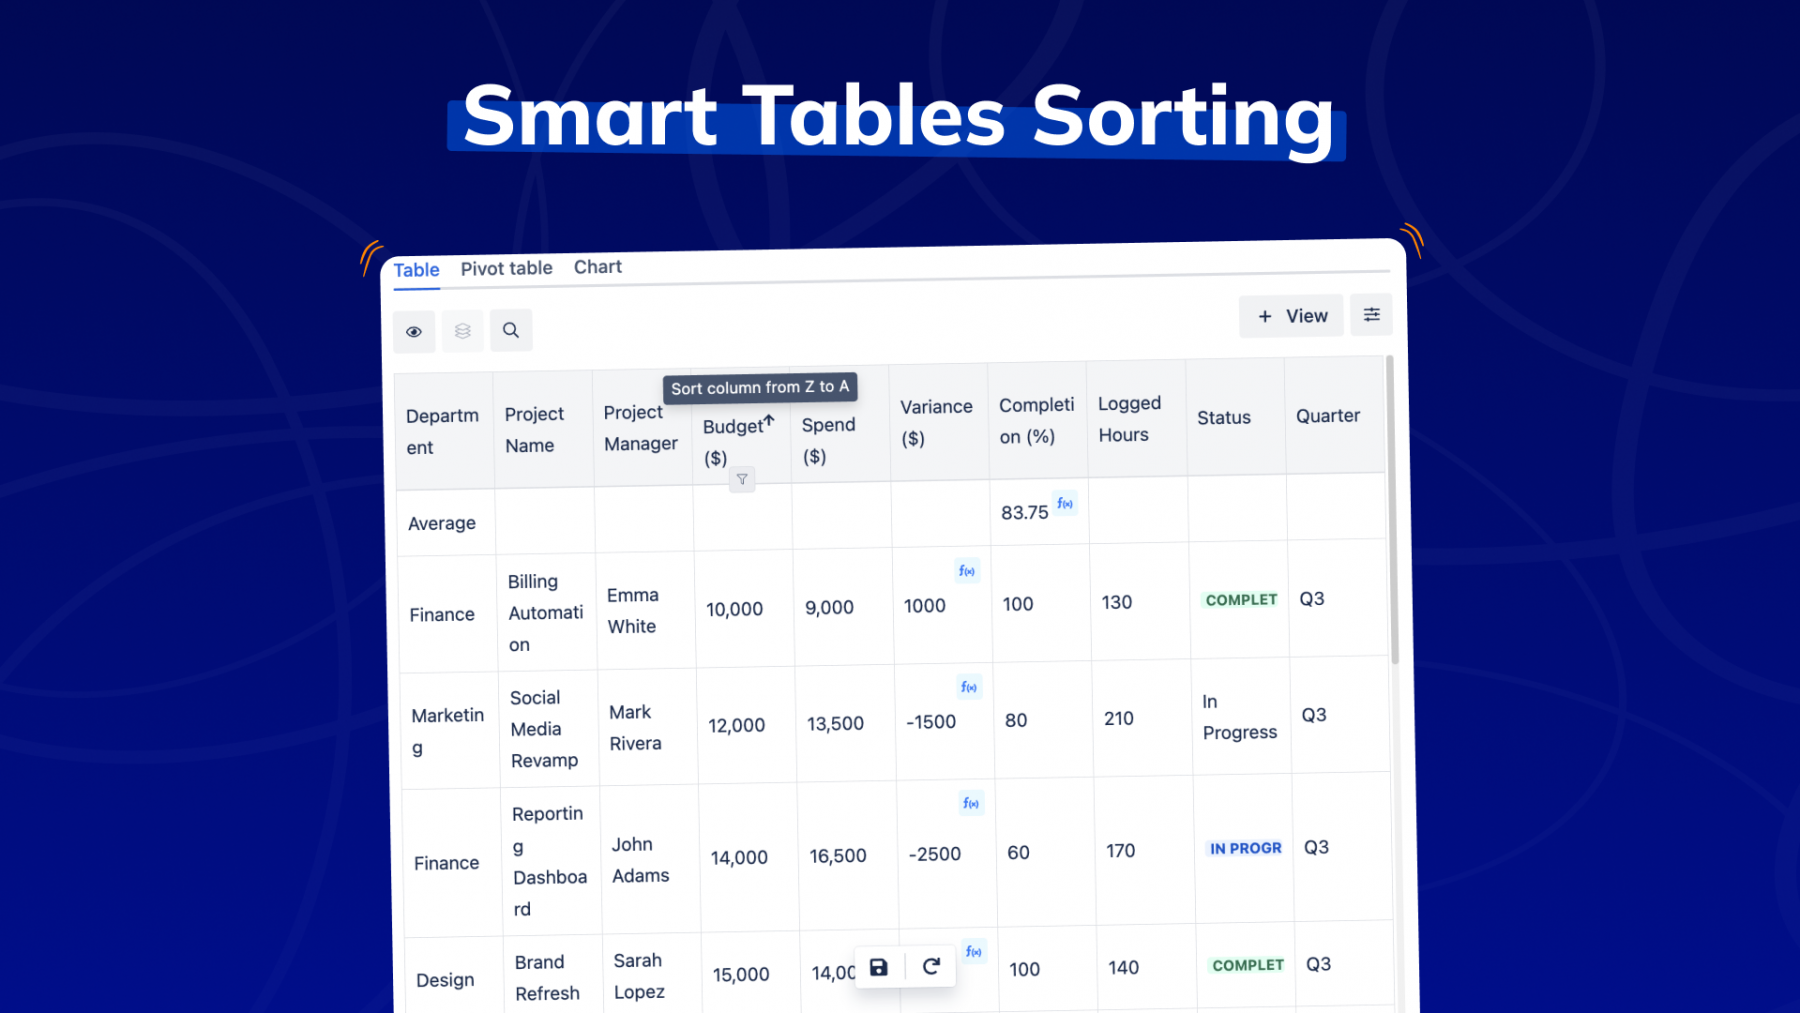
Smart Tables allows users to apply advanced formulas to calculate totals, variances, or completion averages directly inside Confluence. The team can then use grouping to organize results by department, sorting to highlight projects with the largest budget gaps or lowest completion rates.
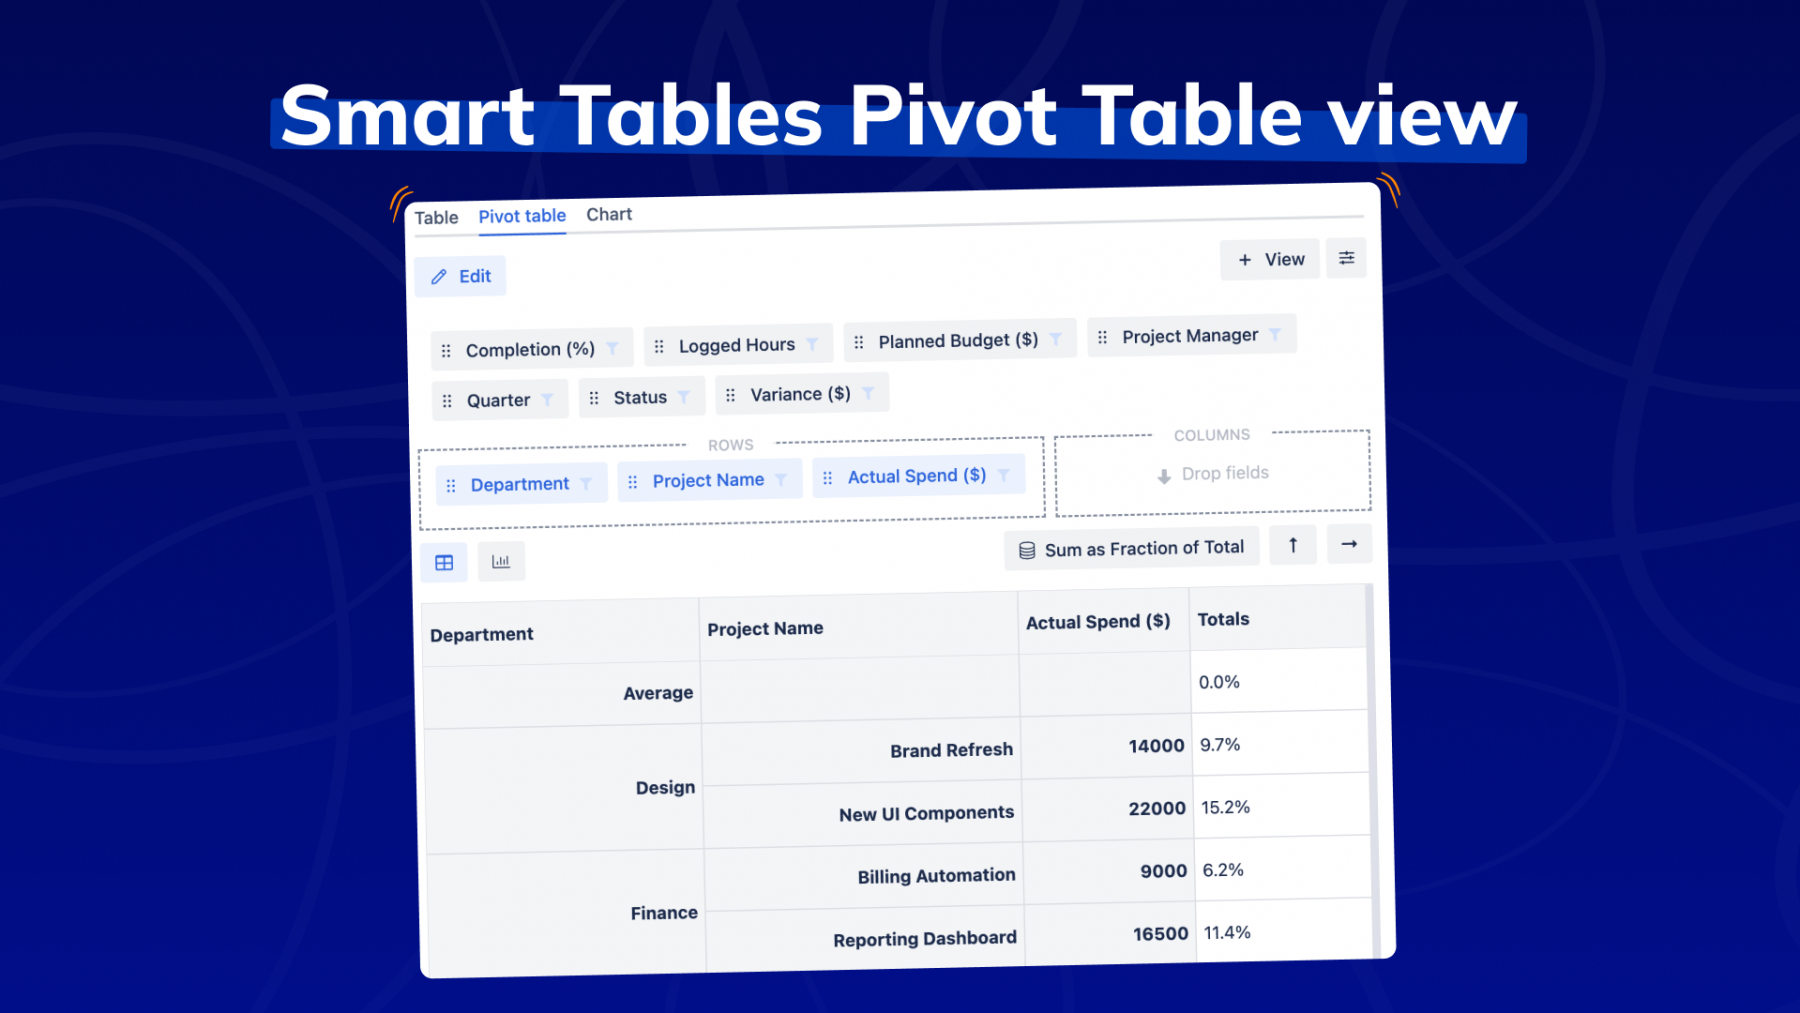
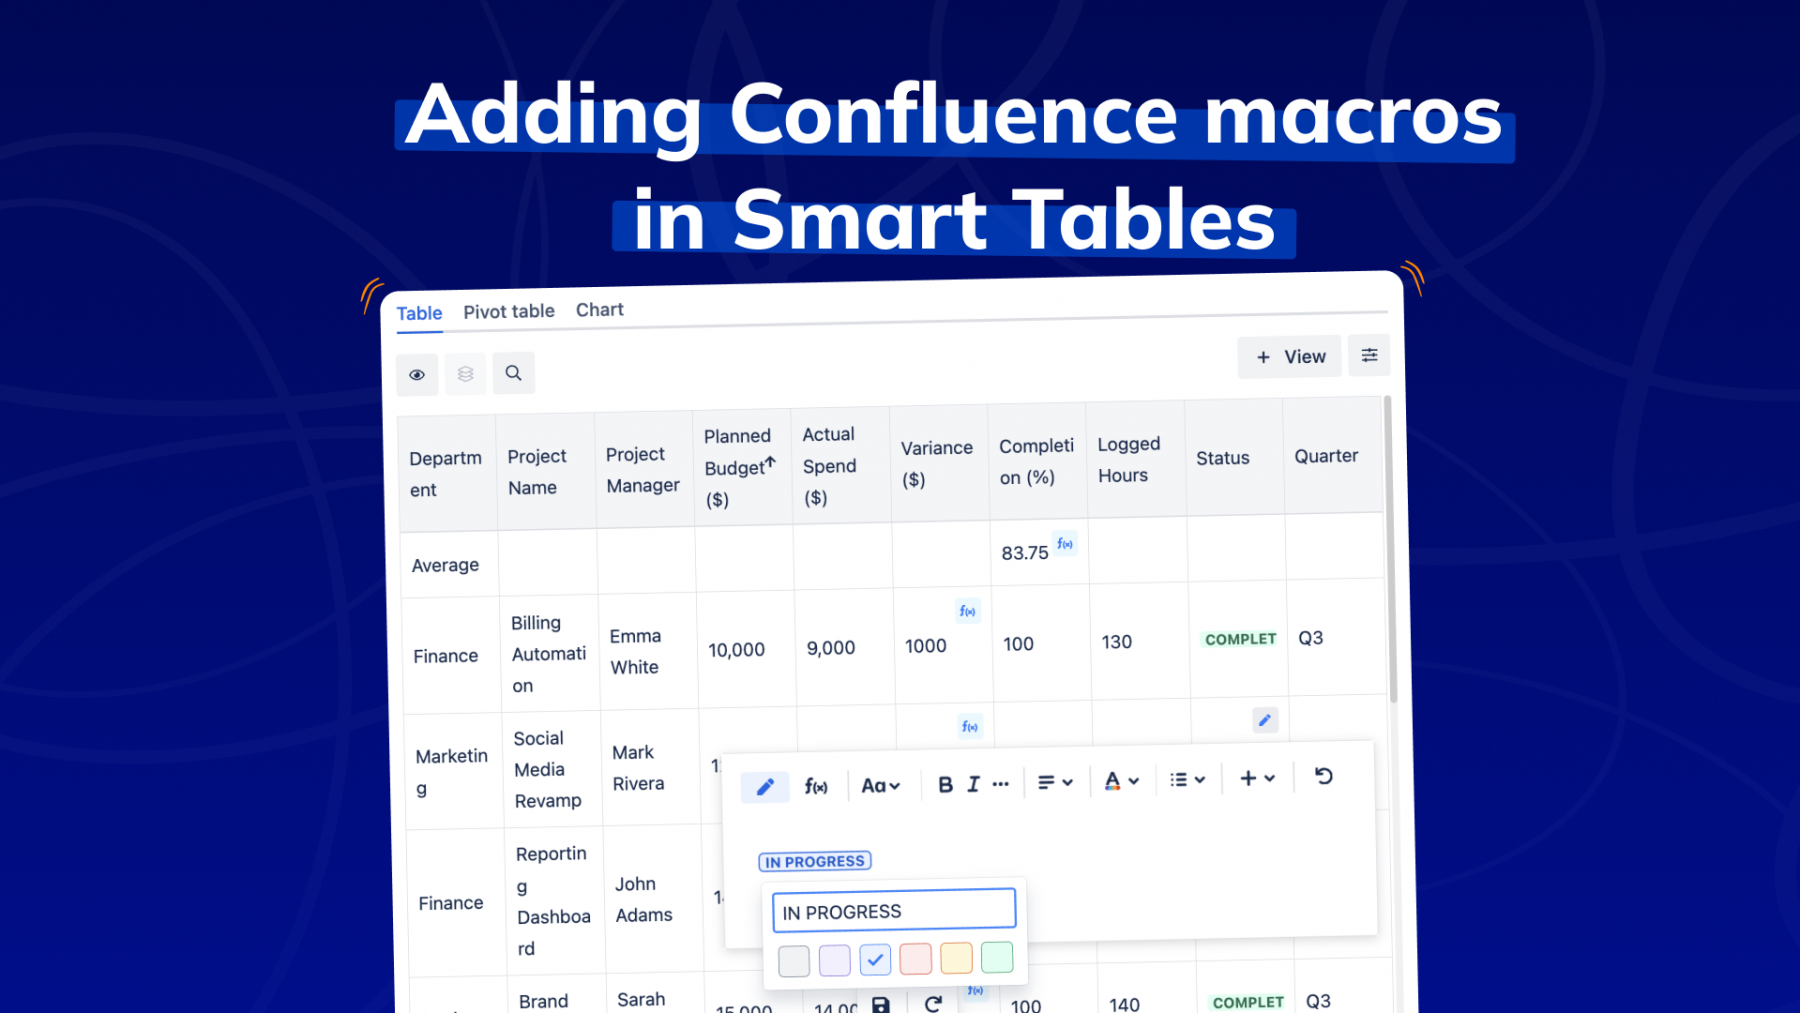
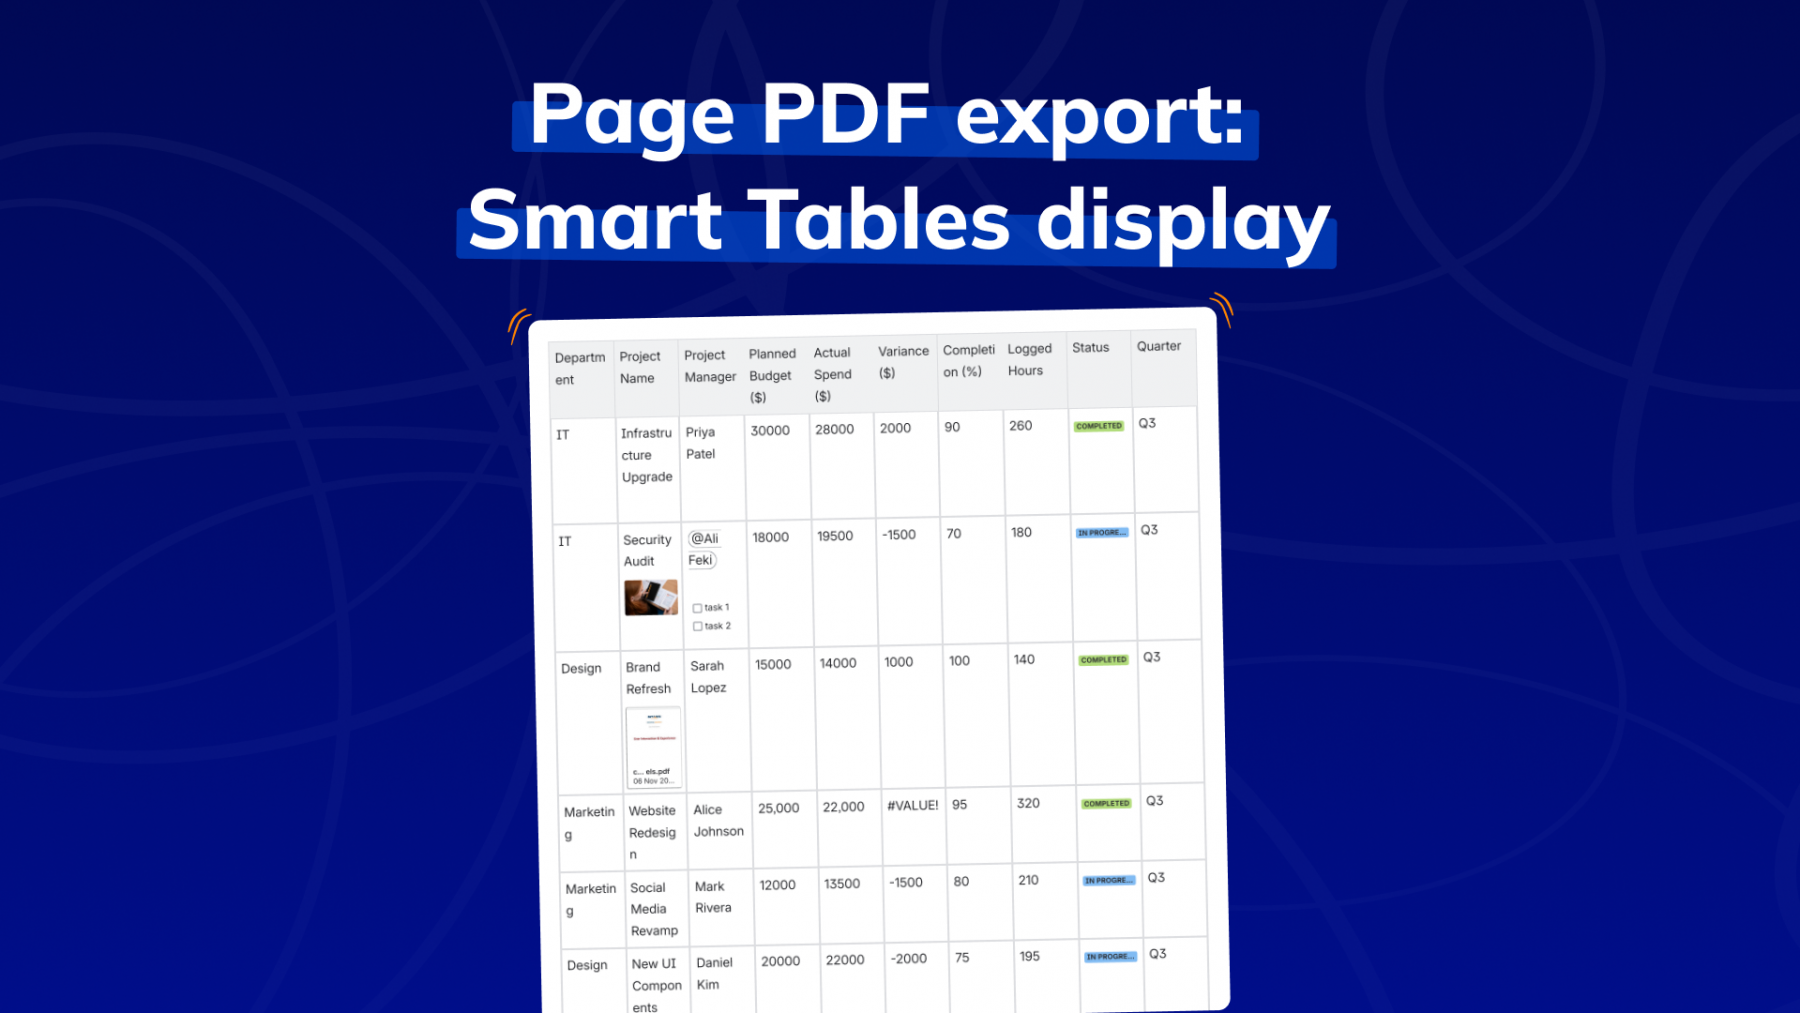
For deeper insights, users can apply filters to focus on specific quarters, departments, or project statuses, for example, isolating only “In Progress” projects or reviewing results from a single department. In addition, Smart Tables supports pivot tables, enabling teams to summarize complex datasets into clear, aggregated views. For example, this allows them to compare total spend versus planned budget across all departments or review average completion rates per quarter. When exporting to PDF, Smart Tables preserves the original Atlassian macro design and table layout, ensuring that charts, panels, and formatting appear consistently. This makes report sharing with leadership smooth, professional, and visually accurate.
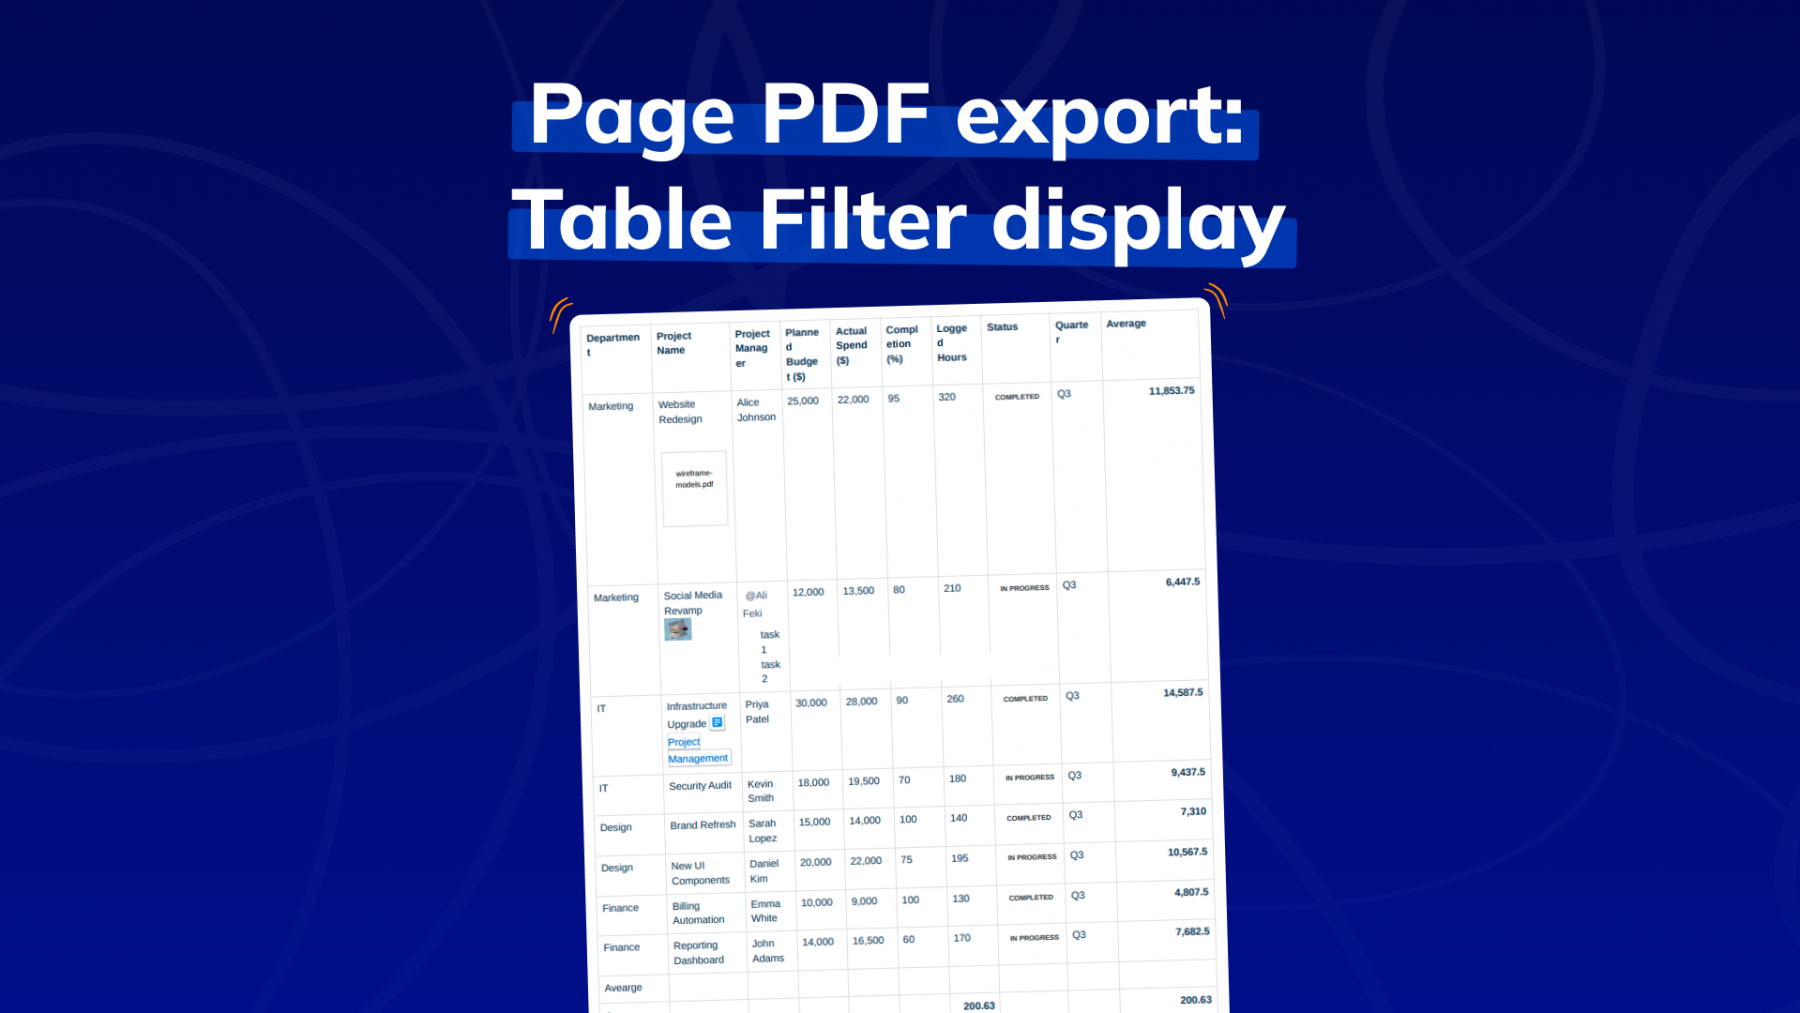
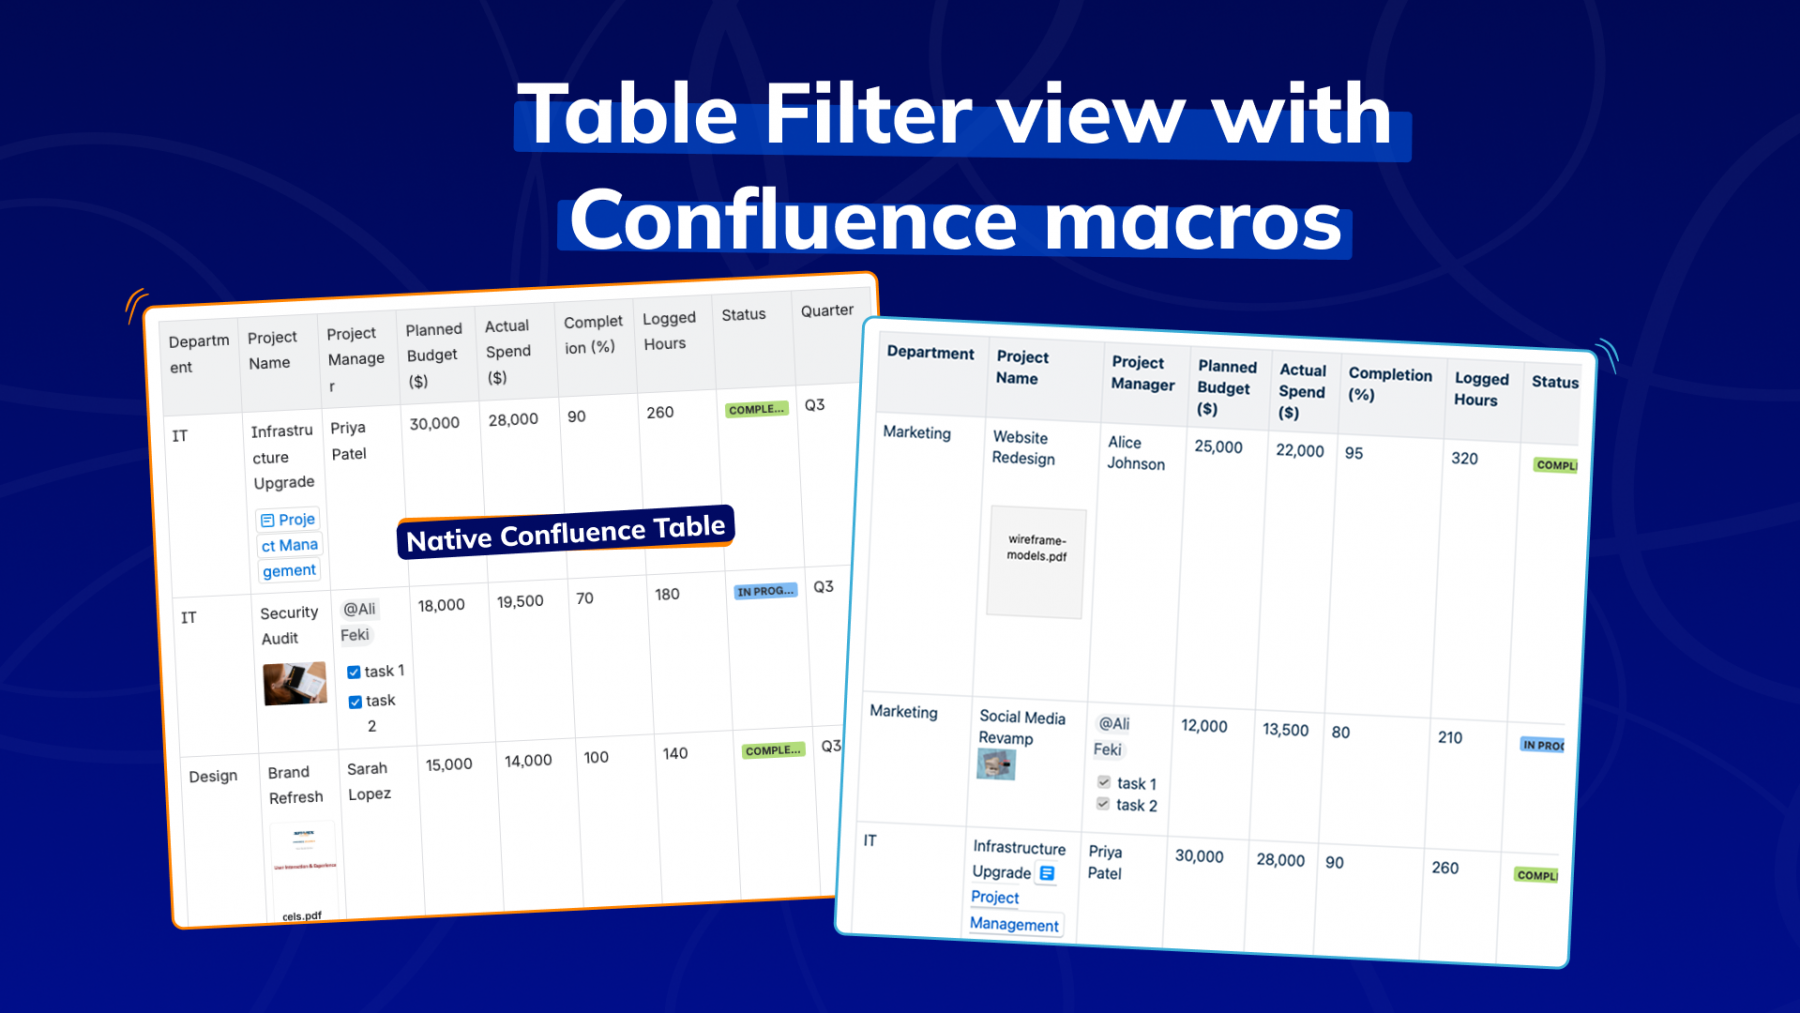
Solution with Table Filter
Table Filter by Stiltsoft supports the team’s need for data analysis through its pivot and formula macros, allowing basic calculations for light comparisons. The team can filter by department or project status and generate summarized overviews using the Pivot Table macro. While it does not support inline grouping in the same way as Smart Tables, grouping can be simulated through pivot configuration. PDF export works reliably for table data but may not fully preserve Atlassian macro styling or complex visual layouts, sometimes requiring post-editing. Overall, it enables solid analytical reporting within Confluence but demands slightly more setup and macro configuration.
Solution with Aura Table Filter
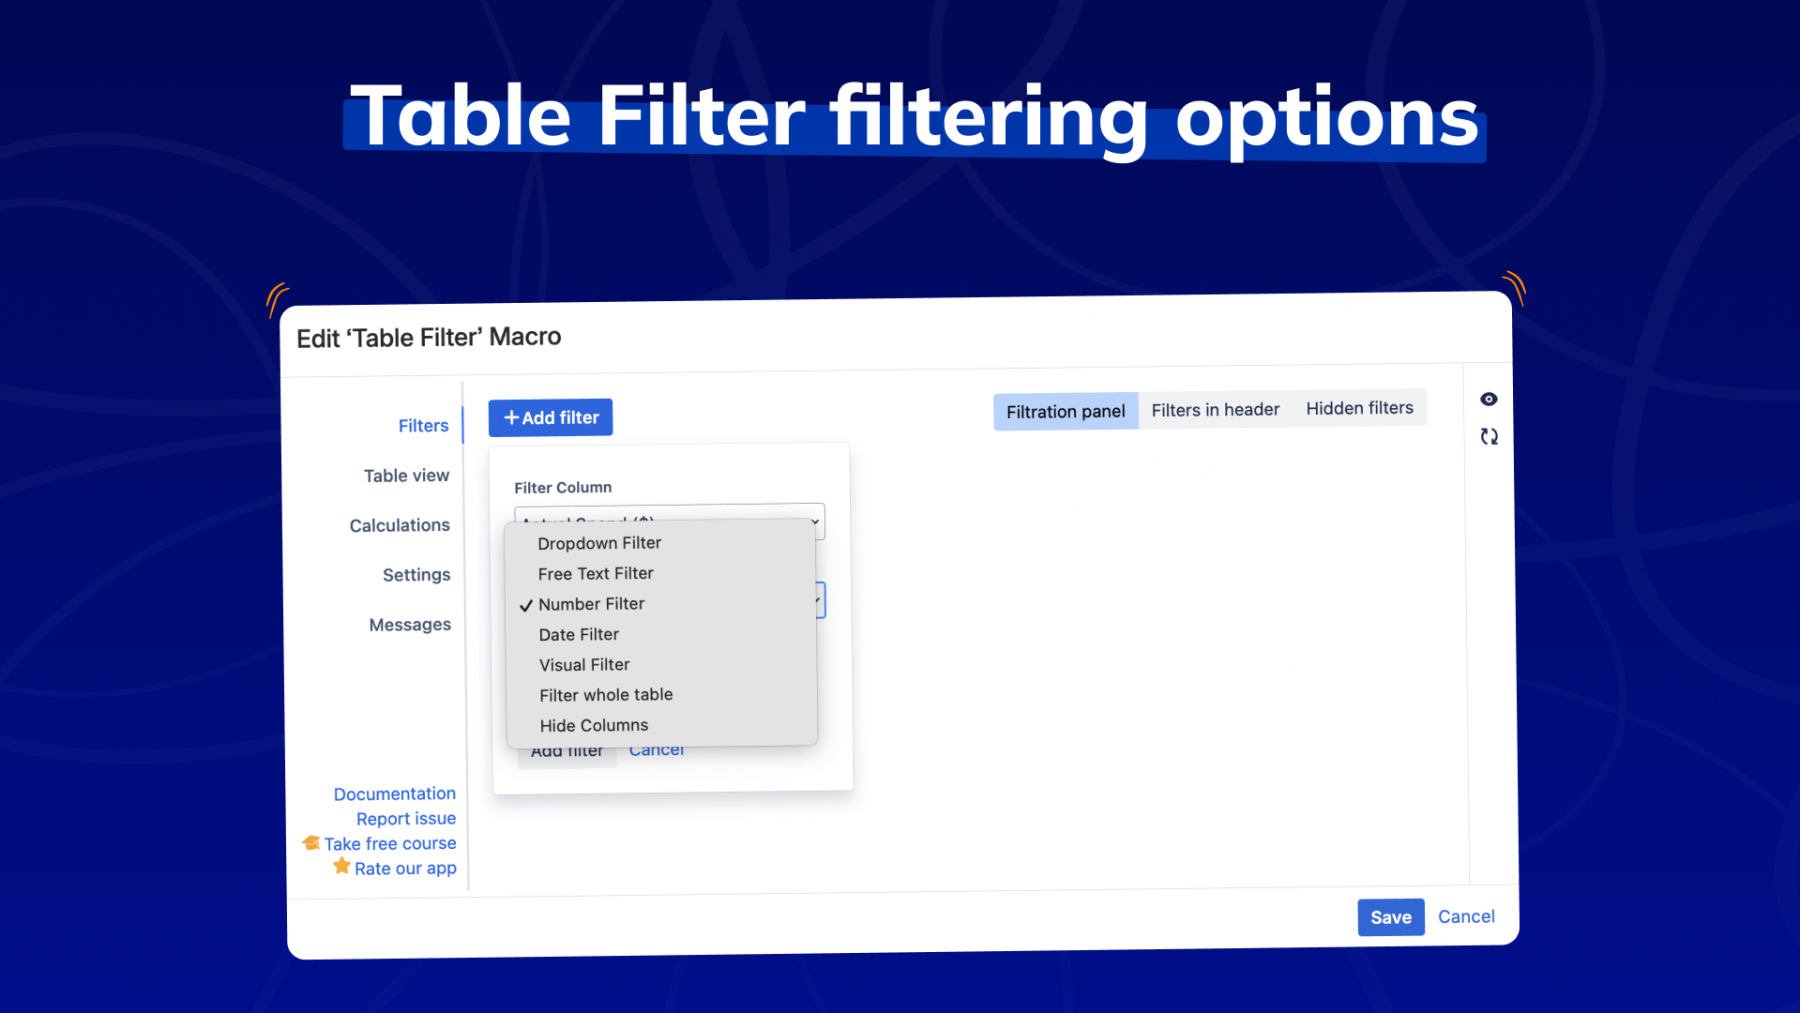
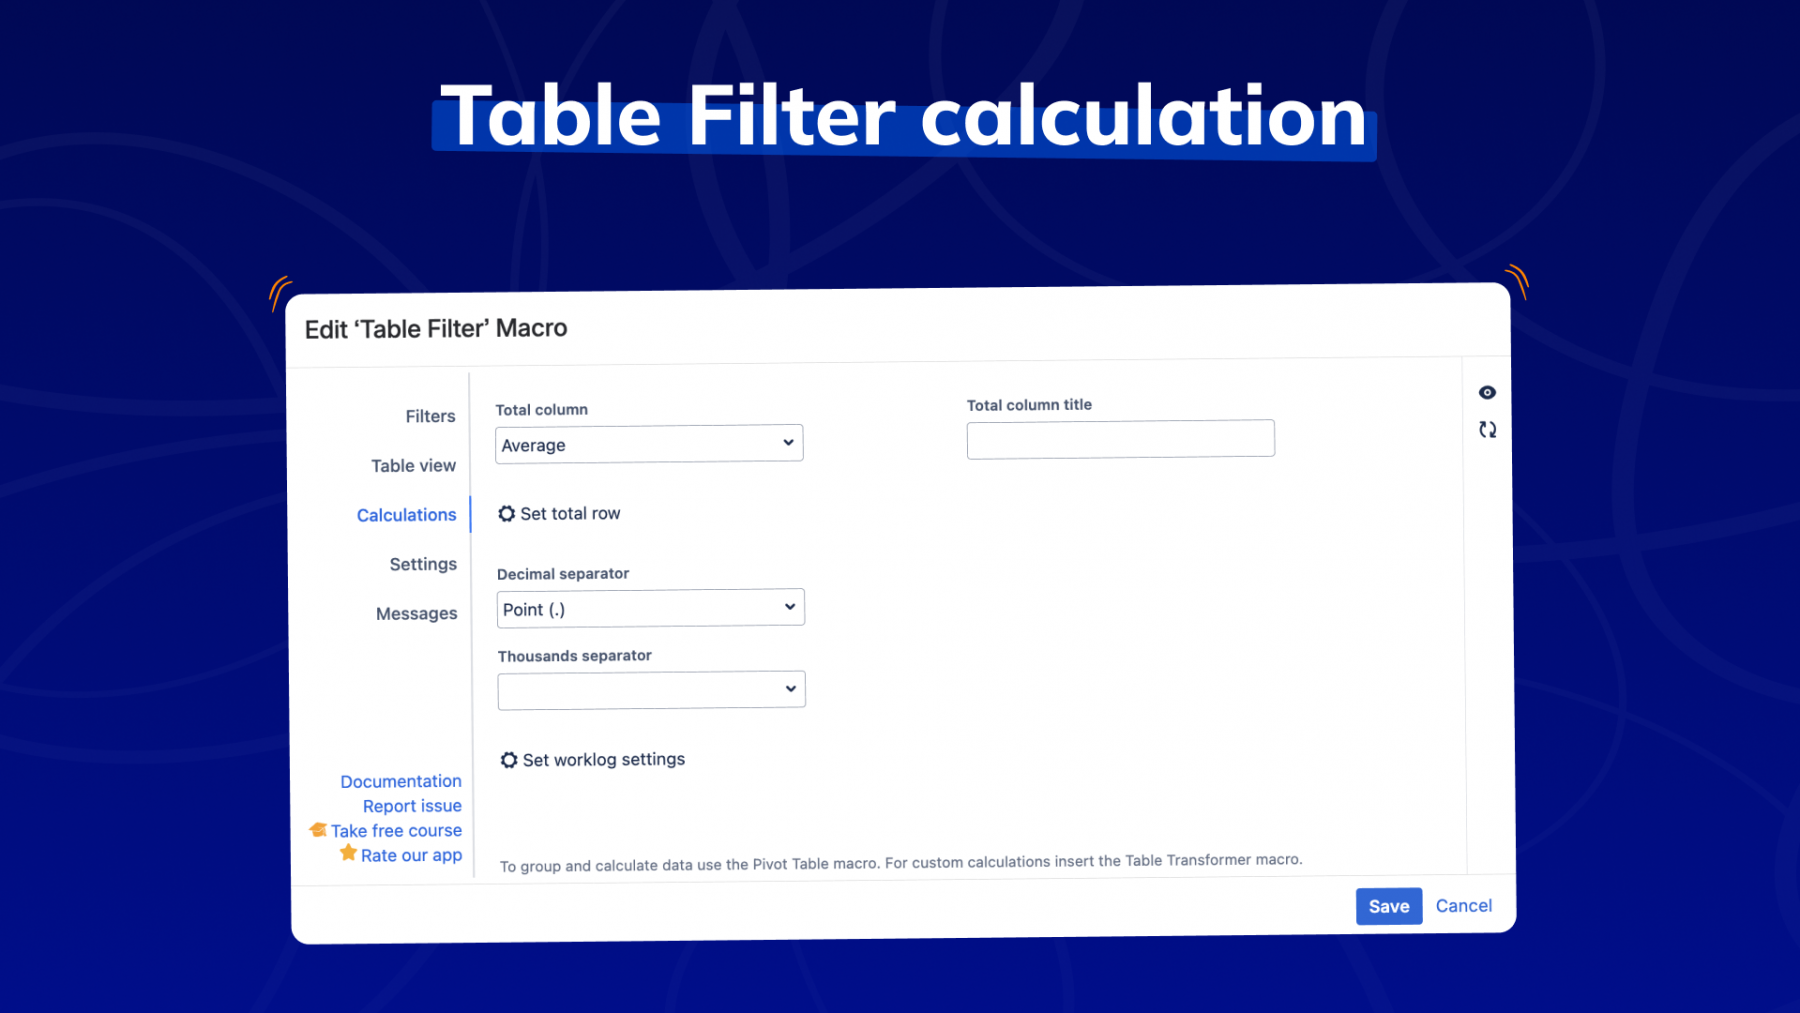
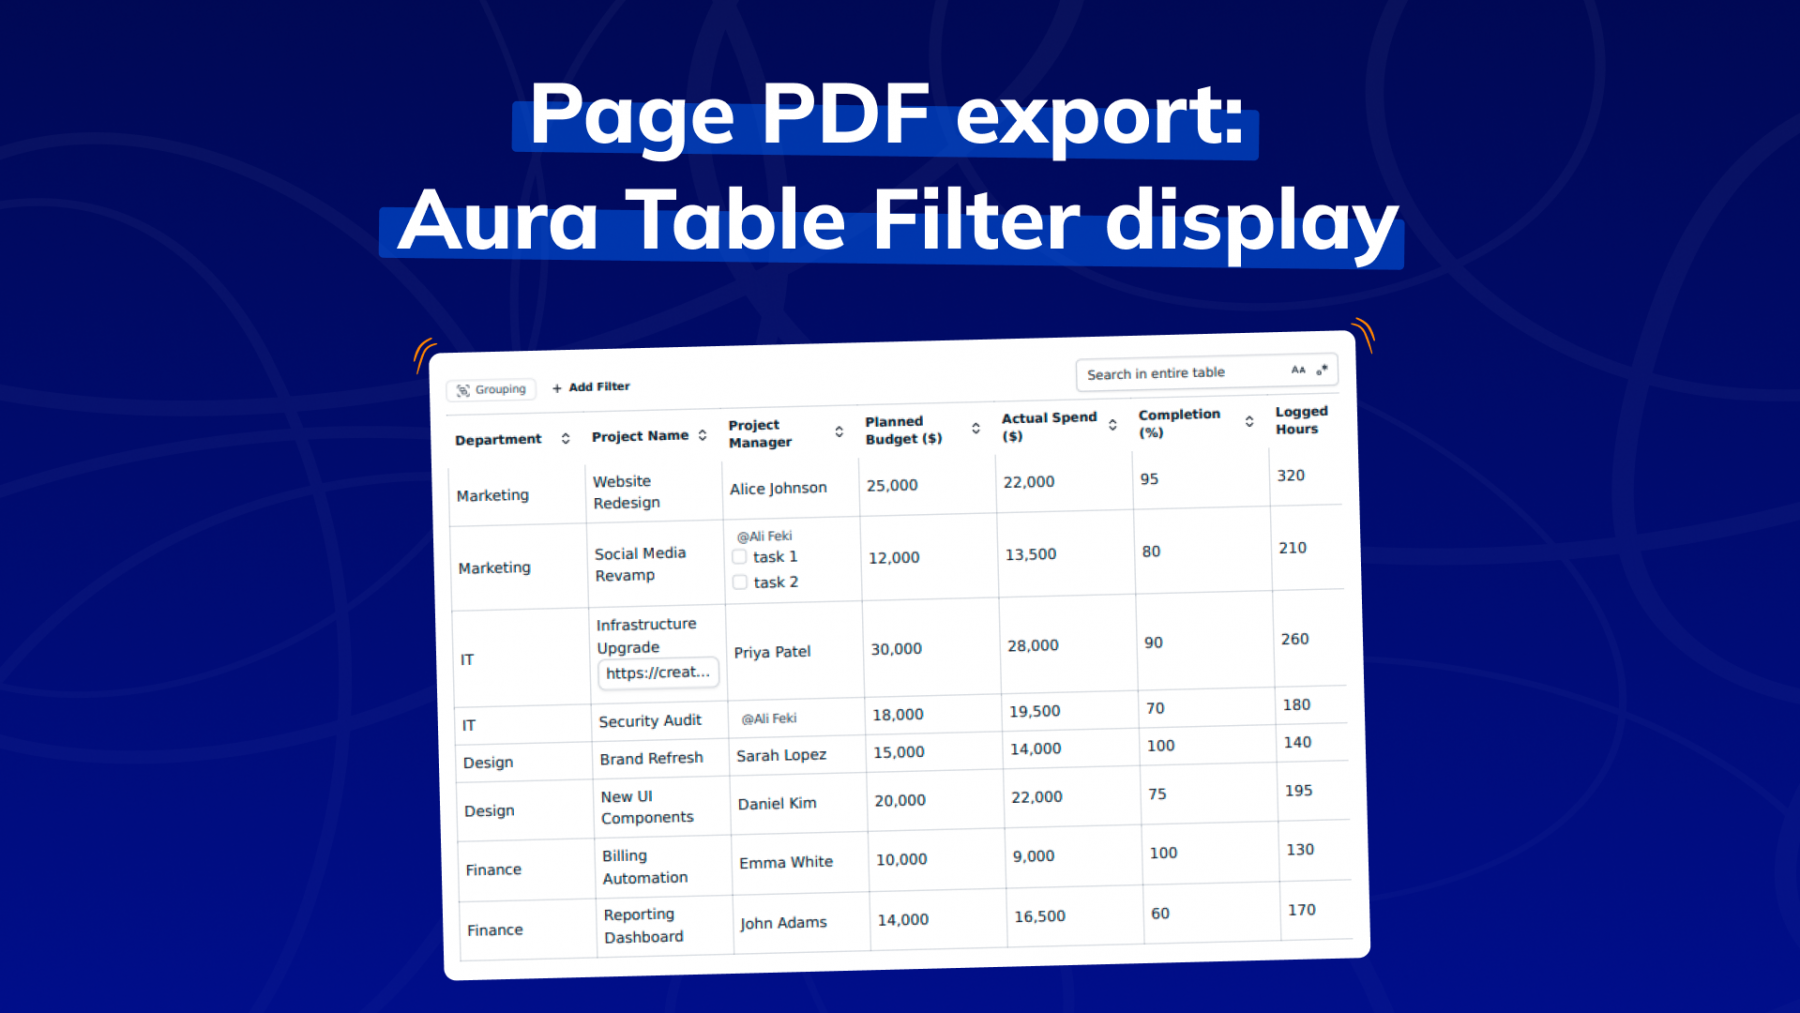
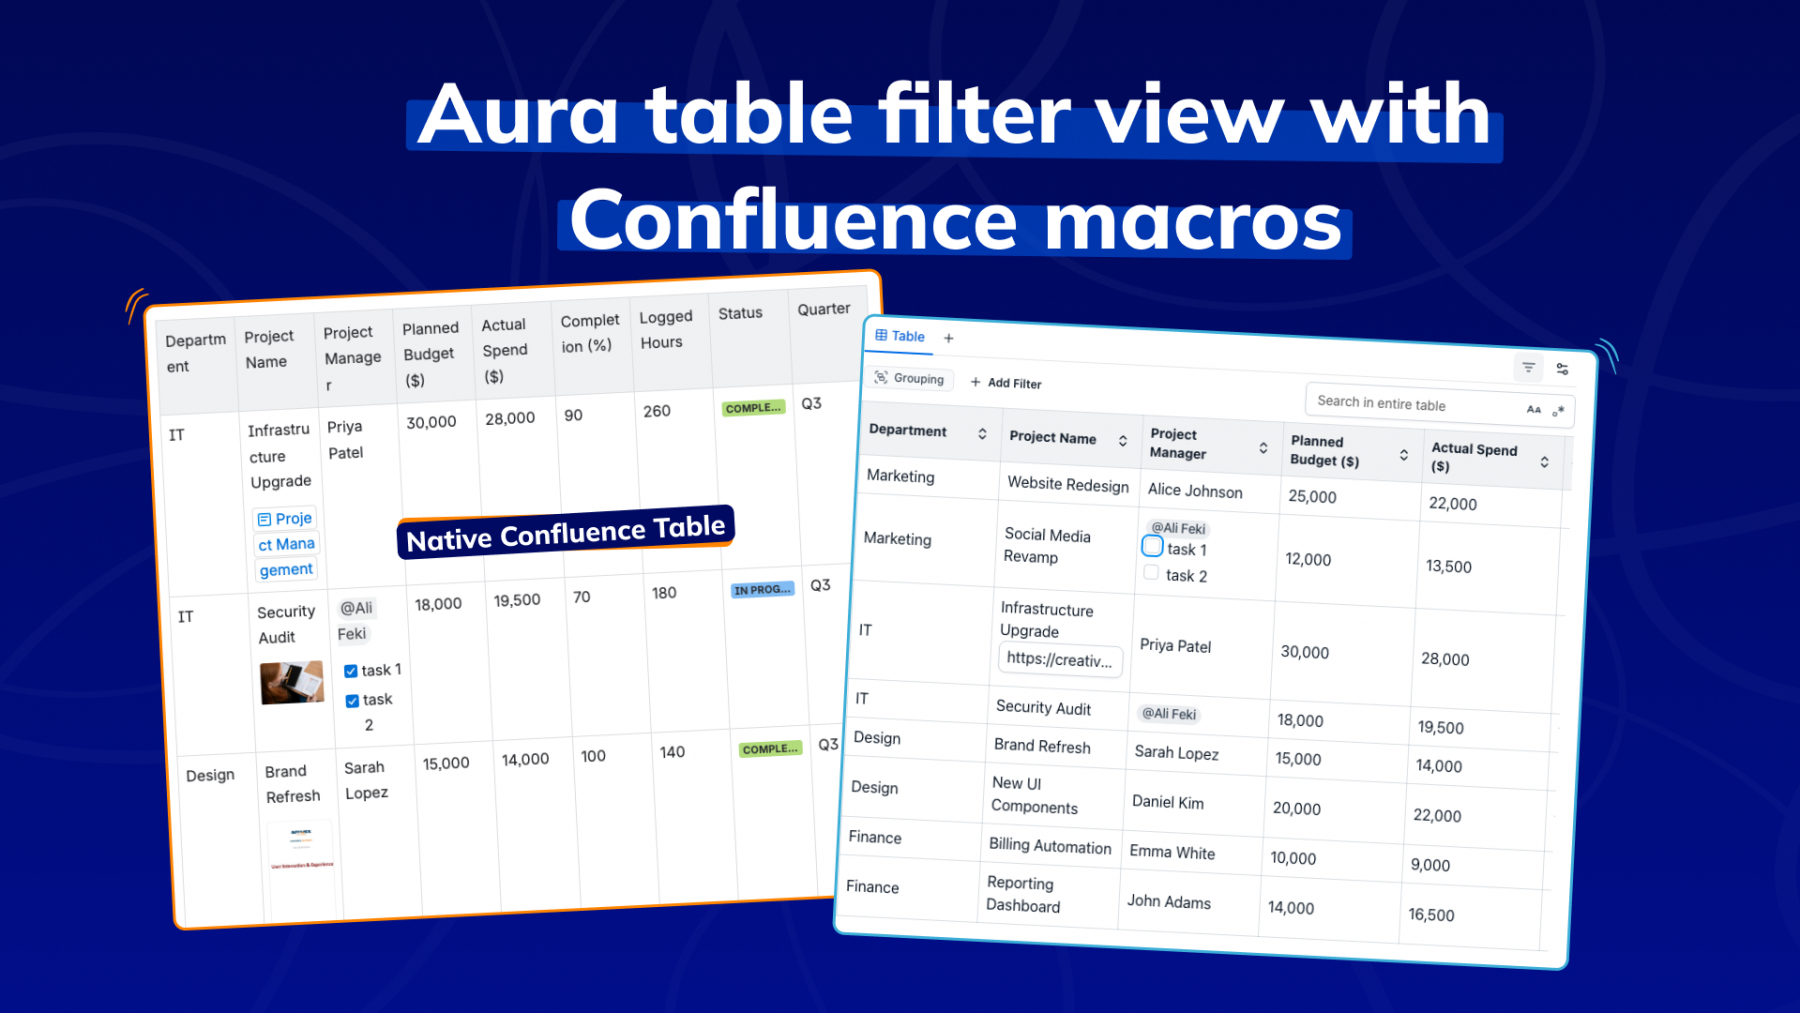
Aura Table Filter helps the team display their quarterly report in a clean, visually structured format. It supports basic sorting, grouping and filtering, allowing managers to quickly narrow down data by department, project status, or timeframe. However, it does not support adding formulas for calculations, which limits its analytical capabilities. Additionally, Aura Table Filter is not fully compatible with most native Confluence macros, which can affect how the layout and styling are preserved during PDF export. As a result, exported pages may not fully match the original design. Aura remains a solid choice for teams that value presentation and visual clarity over in-depth data processing.


In 2025, Smart Tables for Confluence offers one of the most substantial balances of interactivity, formula power, usability, and flexibility, particularly for teams that want to work inside Confluence rather than hopping to Excel. Meanwhile, Table Filter & Spreadsheets remains a compelling, macro-rich option for advanced users building dashboards, merging data, or needing deep macro integration. The Aura table filter still may serve in simpler environments where ease and minimality are priorities.
If you want to learn more about Smart Tables,
Book a demo, and let us get to know you and answer your questions!