Reporting, tracking, and analysis right where your projects live.
Bring insight to your Confluence projects, without leaving your page.
Project management in Confluence doesn’t have to be messy or manual. With Smart Tables, your projects become easier to track, analyze, and share.

Why Project Managers choose Smart Tables?
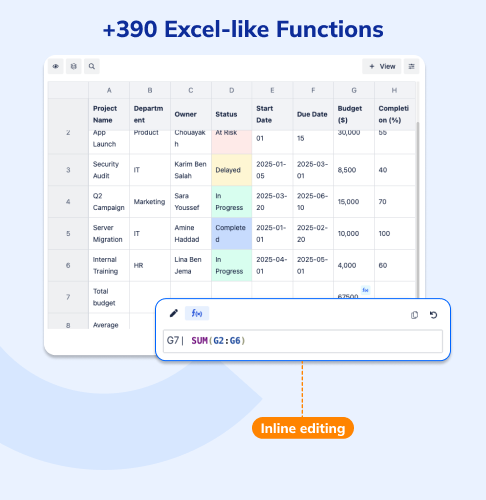
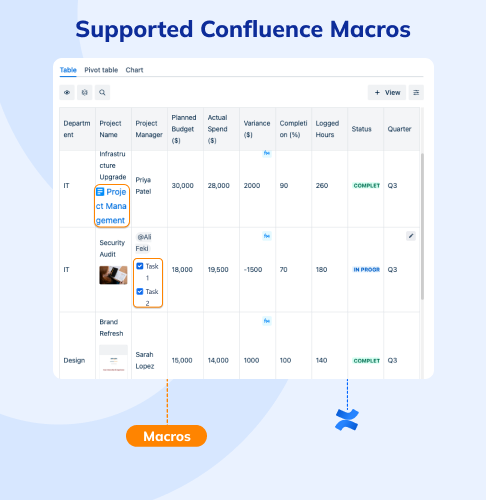
Use Excel- like formulas to calculate totals, variances, or completion averages directly inside your Confluence tables, no external Excel files or Spreadsheets required.
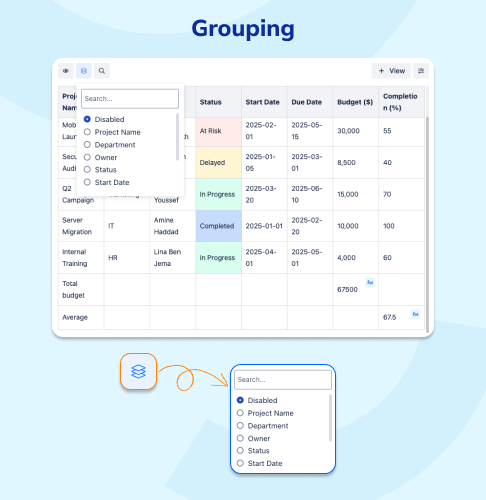
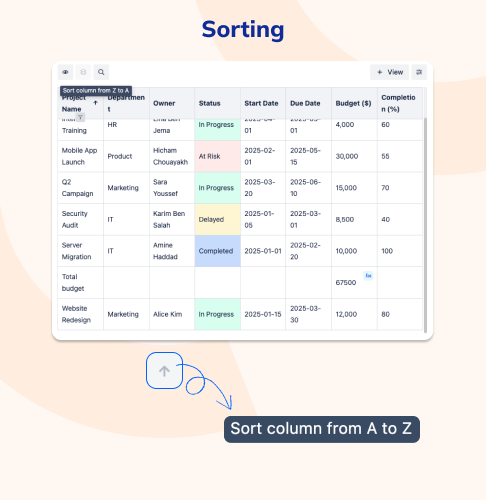
Group projects by department, status, or owner, and sort your data to spot bottlenecks and priorities instantly.
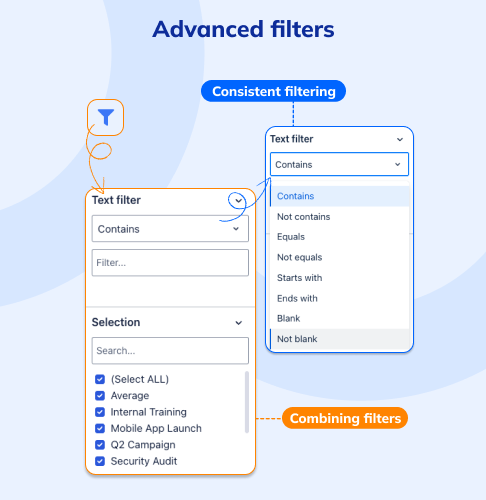
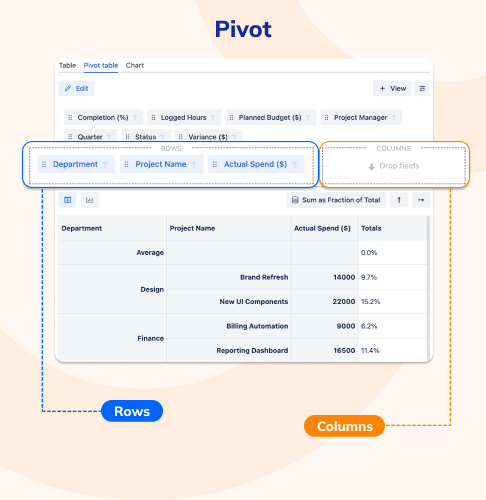
Apply filters or build pivot tables to focus on a specific quarter, team, or set of active projects.
Create charts from your tables in seconds for a clear, story-driven view of your data.
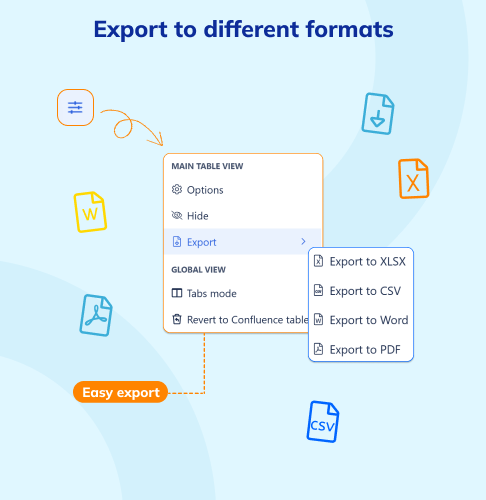
Generate professional PDFs that keep your Atlassian macros, colours, and layouts perfectly intact.
100% Forge-native, designed for speed, security, and efficient integration with your existing pages and macros.
Say goodbye to copy-pasting data into Excel.
With Smart Tables, project reports update instantly and stay visually consistent.
Use pivot tables to summarize team results, or charts to visualize progress by department or milestone, all on a single Confluence page.
When you’re ready to share, export a PDF report that keeps every macro, chart, and color perfectly formatted, ready for leadership or clients.
Get Smart Courses full demo!
Reliable, Feature-Rich
![]()
![]()
![]()
![]()
Thanks for fast support and new functions in your product. I will use this plugin in my work. Recomend.
Przemysław Ceniuk
Exactly What You Need
![]()
![]()
![]()
![]()
Simply added basic functionality that solves 99% of the daily needs.
Manuel Schaffner
Simple, Effective, Essential
![]()
![]()
![]()
![]()
A very useful app. However the high rating is primarily for the excellent support by Creativas. Highly recommend!
Sarah K.
FAQ
How can Smart Tables improve project management?
Can I use formulas like in Excel?
Does Smart Tables work with existing Confluence pages?
Can I build charts from my tables?
Can I export my tables and reports?
Still have unanswered questions? Check our documentation


