The easiest way to train and track in Confluence
Confluence has long been a central knowledge hub for teams, enabling collaboration, documentation, and information sharing. However, on its own, Confluence lacks built-in features for structured training or data analysis. By adding Smart Courses and Smart Tables, you can keep learning and analytics in the same workspace. For example, Smart Courses transforms Confluence into a full-featured LMS (Learning Management System), so you can build courses and quizzes using your wiki content.
At the same time, Smart Tables brings powerful spreadsheet capabilities into Confluence tables. You get Excel-like formulas, filters, sorting, and charts right on the page, without exporting to external tools. Together, these apps let teams learn and manage projects in one place, without having to jump between systems.
TL; DR
- Built-in LMS: Smart Courses adds course creation, quizzes, and certifications. Instructors use an intuitive editor to organize training modules from existing pages, videos, or SCORM content.
- Excel-like Tables: Smart Tables gives any Confluence table 390+ built-in functions, plus advanced filtering, sorting, pivot tables, and charting. You can edit tables inline, import/export data, and build dynamic dashboards without leaving Confluence.
- One Platform: The two apps complement each other so your workspace becomes a unified learning and reporting hub. Employees can take courses and see their progress, and managers can track real-time project metrics, all within the same Confluence site.
Smart Courses for Confluence
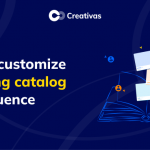
Smart Courses brings a full LMS into your Confluence site. Instructors can use the drag-and-drop course editor to assemble lessons from Confluence pages, images, videos or SCORM modules. Smart Courses editor: you simply create sections and lessons, then choose existing wiki pages or files to include. This makes it easy to turn your documentation and know-how into structured courses. Smart Courses also supports interactive quizzes, including graded exams, so learners can test their understanding and earn certificates automatically.
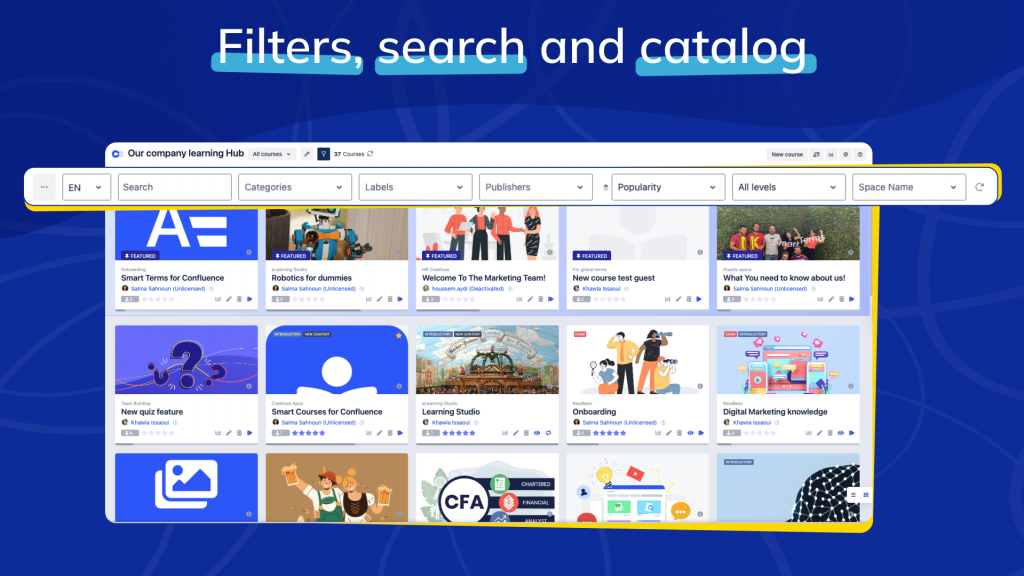
All courses appear in a global, searchable catalog where team members can self-enroll and learn at their own pace. Behind the scenes, Smart Courses provides dashboards and reports that track enrollments, completion rates, and quiz scores for every learner. In short, it enables you to deliver and monitor training directly within Confluence.
Key features of Smart Courses include:
- Course Editor: Assemble courses right in Confluence, reusing pages and media. You can structure content into chapters, add videos or images, and PDF files.

- Quizzes & Certificates: Create multiple-choice or open-ended quizzes and exams to reinforce learning. Smart Courses automatically tracks scores and can issue a completion certificate to learners who pass.
- Course Catalog: Publish training in a global catalog with filtering and search. Employees browse and enroll in courses relevant to their role or department, and progress through content at their own pace.
- Insights and reporting: Managers and learners see real-time status in a built-in dashboard. You can view who has started or finished each course, how they scored on quizzes, and identify any knowledge gaps.
- Skills & Prerequisites: Define key skills, link them to courses or exams, and control learner progression with prerequisites that guide users through structured courses.

Smart Tables for Confluence
Smart Tables enhances Confluence’s native tables, transforming them into interactive, data-driven components that teams can manage, analyze, and collaborate on. Instead of switching between Confluence and external spreadsheet tools, you can create Smart Tables directly on your pages or import data from Excel using the Live Spreadsheet macro for real-time editing and collaboration.
Each Smart Table supports advanced capabilities, including inline editing, sorting, grouping, filtering, and formulas, providing the analytical power of a spreadsheet while remaining fully integrated within Confluence. Whether you’re tracking project progress, managing reports, or analyzing results, Smart Tables keeps your data dynamic and organized.
Smart Tables capabilities
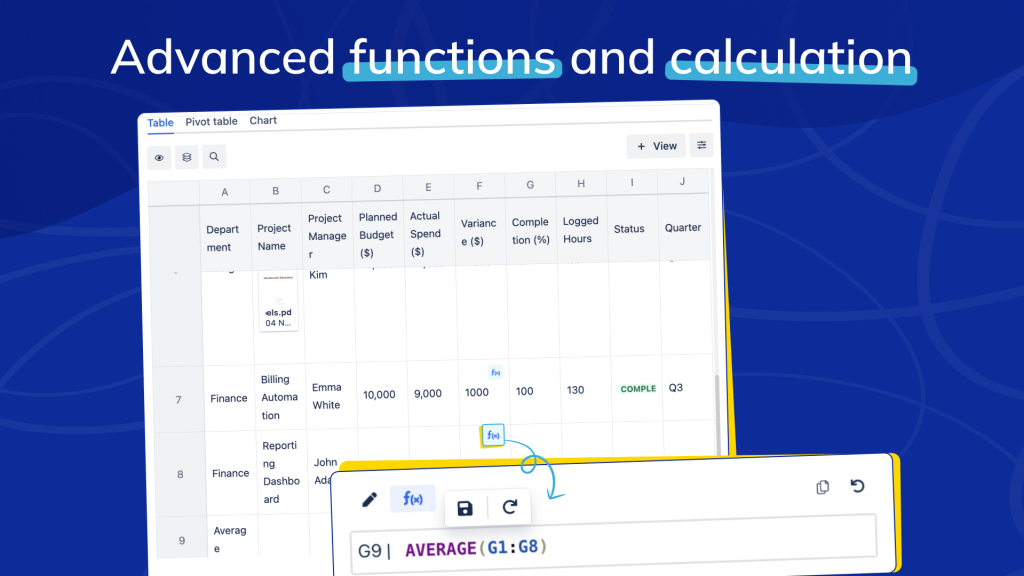
- Formulas and Functions: Apply over 390 built-in functions (SUM, AVERAGE, IF, VLOOKUP, etc.) to calculate and analyze data directly inside your tables.
- Advanced Filtering, Sorting & Grouping: Quickly organize information with dropdown filters or sort/group options to focus on what matters most.


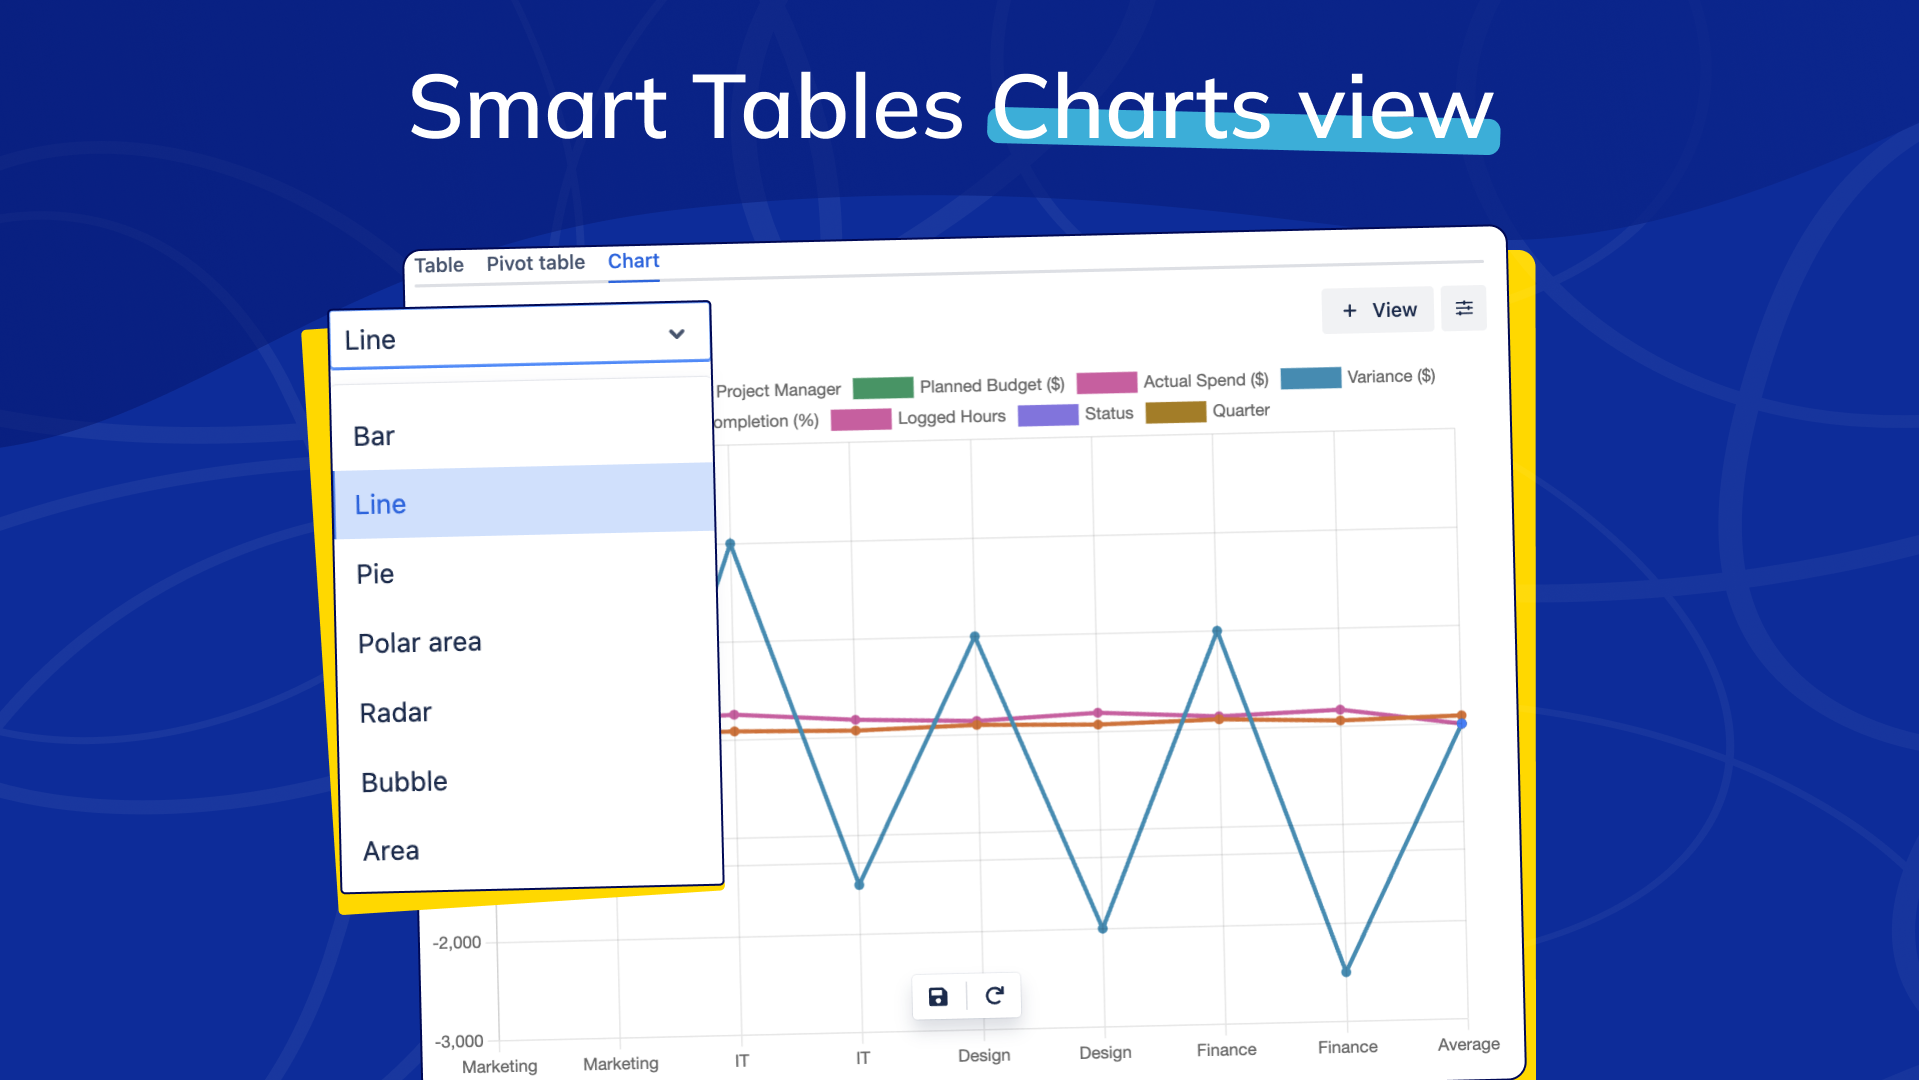
- Charts and Pivot Tables: Visualize key insights directly from your Smart Tables with built-in charting and pivot tools, updating automatically as data changes.

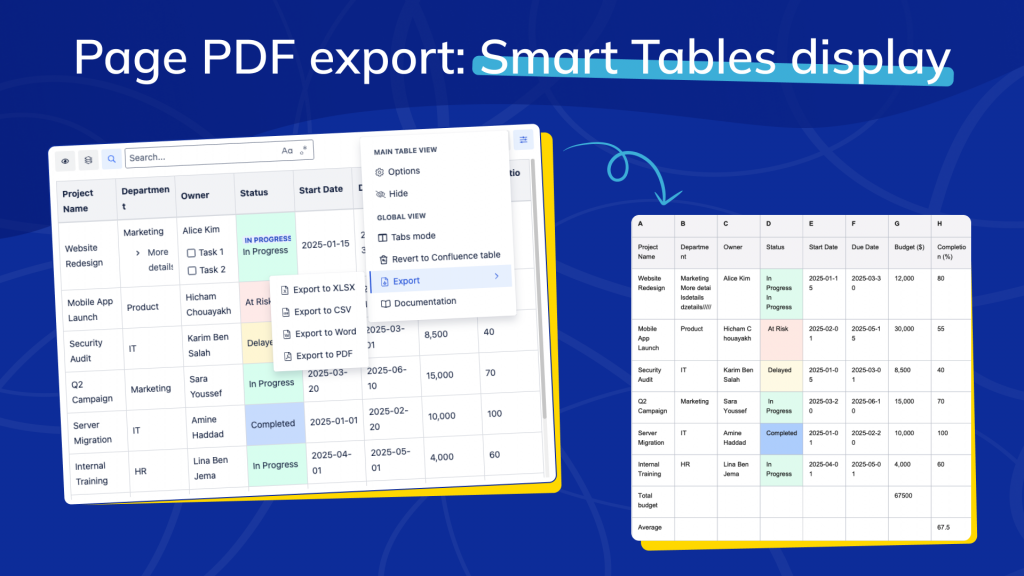
- Export: export your tables to PDF for easy sharing and reporting.
Use Case: Unified Project Learning and Tracking
Imagine a cross-functional team preparing for a major product launch. Their Confluence space becomes both a training hub and a project command center.
With Smart Courses for Confluence, the project lead creates a “Product Launch” course to onboard new team members. The course includes lessons on product details, workflows, and marketing guidelines, all within Confluence. With Skills & Prerequisites, new hires must first complete the “Product Knowledge Basics” course to earn a required skill before unlocking more advanced modules like “Launch Execution.” Thanks to group enrollment rules, new joiners are automatically added, receive reminders, and must complete a short quiz to earn the “Launch Readiness” certification. The manager can easily monitor progress, see who’s finished the course, and identify knowledge gaps across teams.
Meanwhile, the Smart Tables macro powers the project’s live tracking dashboard. The main planning page hosts a Smart Table listing every task with columns for owner, department, due date, and status. Team members edit their tasks inline, and updates appear instantly for everyone.
To make the data actionable:
- Sorting helps prioritize tasks by approaching deadlines.
- Grouping clusters work items by department or phase to reveal workload distribution.
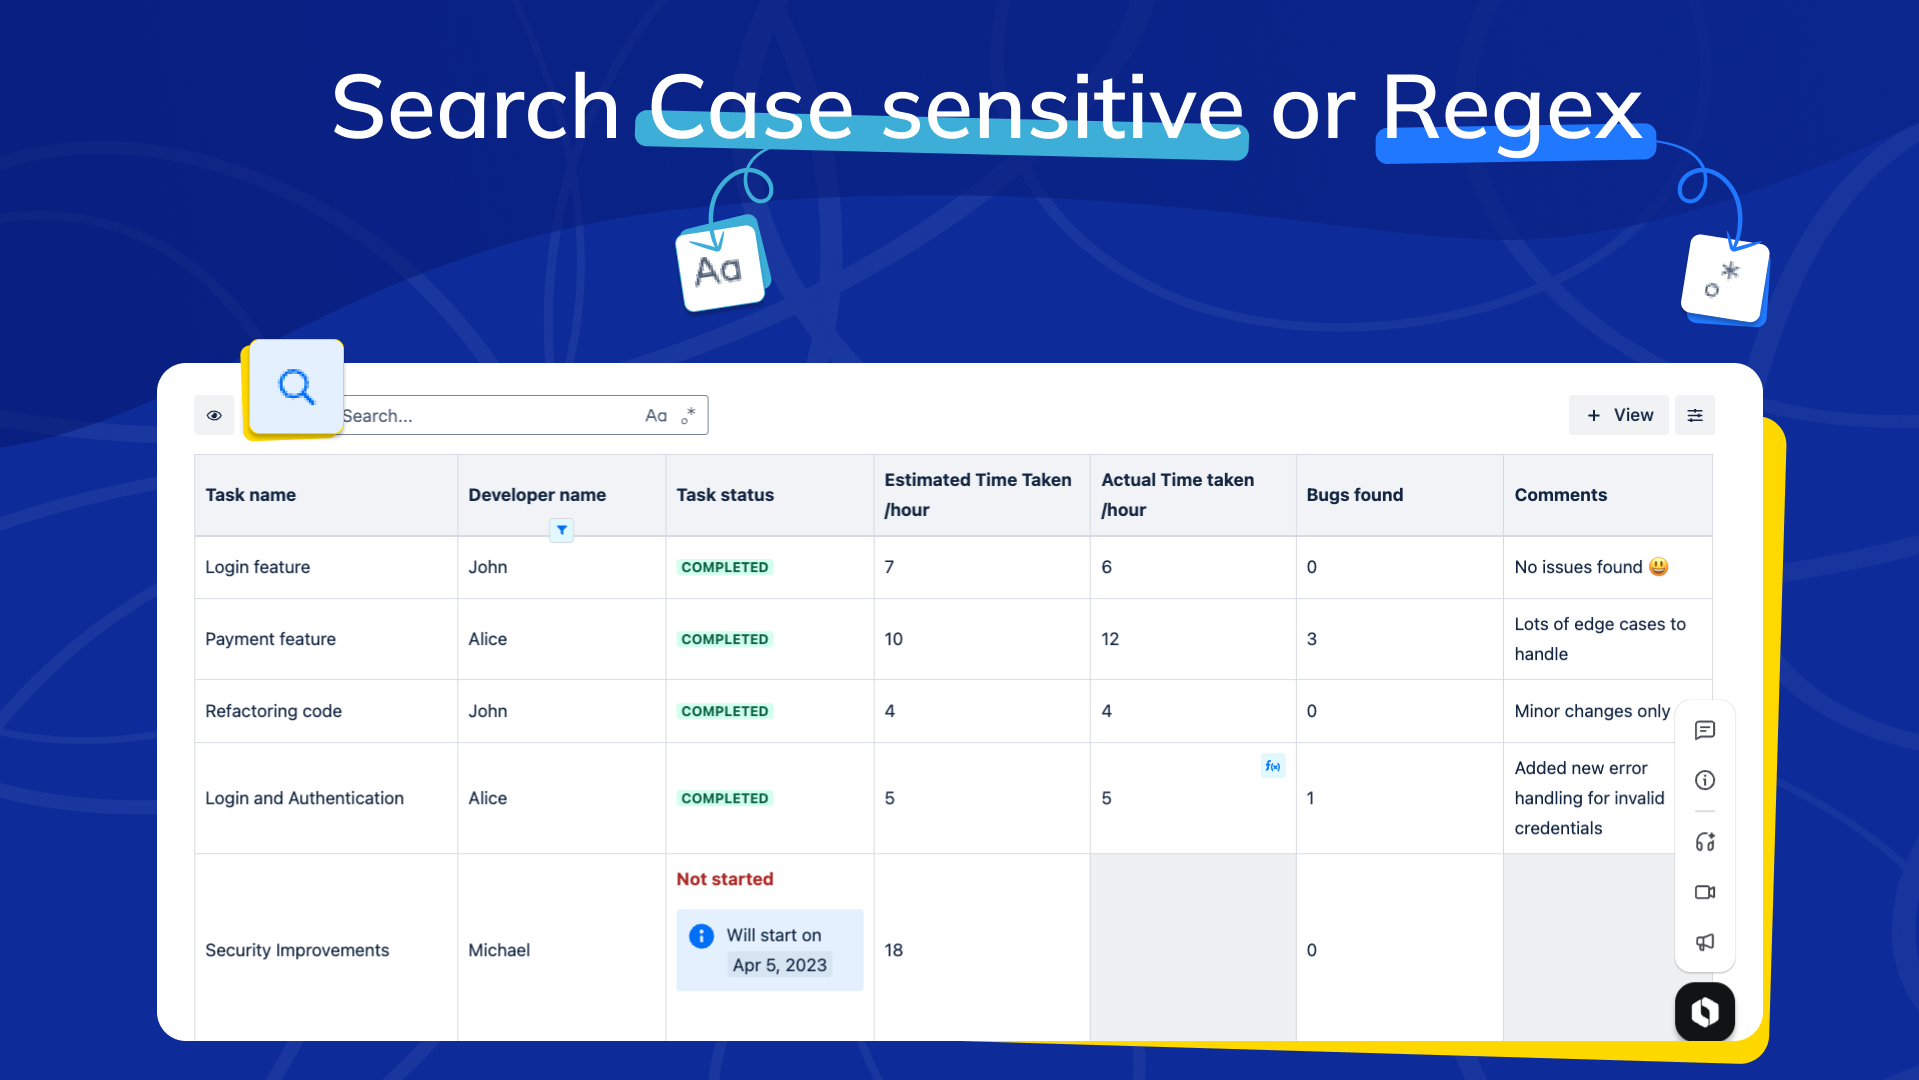
- Search and Case-Sensitive Search let the manager instantly locate specific entries, such as “Q4 Budget” or “Launch-Day Checklist.”
- Regular Expression Search identifies all items matching complex patterns (for example, all milestones starting with “Phase”).
- Pivot Tables summarize hours logged and tasks completed by department, giving leaders a clear overview of performance.
The manager also uses filters to display only “In Progress” items, while a live chart visualizes workload by phase. Every metric updates automatically as team members make changes; there are no page reloads and no version conflicts.
Because training and tracking occur in a single Confluence space, the team gains full transparency. The same dashboard displays who has completed their onboarding milestones, which skills they’ve earned, and the current project status in real time.
By combining Smart Courses and Smart Tables, this organization has established a comprehensive learning, skills-building, and tracking ecosystem. Employees gain the foundation they need right where they collaborate, and managers gain data-driven insights all without leaving Confluence.
ConfluenceLearningOnboarding