SQL views for Confluence tables: query large datasets without leaving Confluence

TL; DR
Smart Tables for Confluence now supports SQL Views, giving teams a new way to explore large datasets directly inside Confluence.
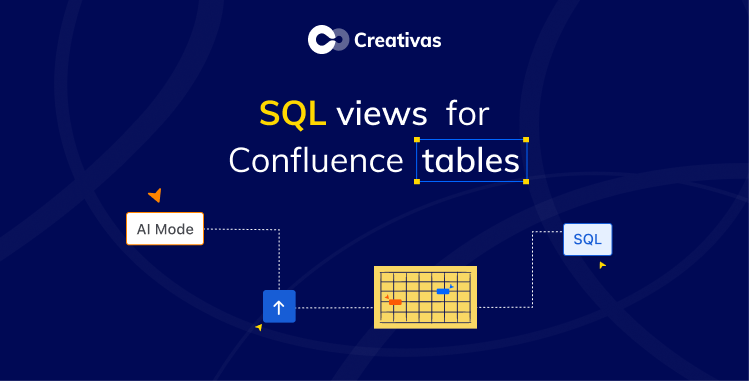
Write your own SQL query or simply describe what you’re looking for in plain language. AI Mode generates the SQL automatically, creates an adjustable SQL query, and keeps everything connected to the same dataset.
What’s new?
Smart Tables has always helped teams organize information with sorting, grouping, filtering, global search, pivot tables, charts, and formulas. We’ve added a new advanced feature: SQL Views.
Instead of creating multiple filtered tables or repeatedly combining filters and formulas, you can now create adjustable SQL queries that answer more complex questions, all while working from the same table.
If you don’t know SQL, that’s fine. Simply describe the result you want, and AI Mode generates the SQL query for you.
Whether you’re managing project portfolios, sprint backlogs, financial reports, asset inventories, or compliance registers, Smart Tables now lets every team explore data with the level of precision they need.
Built on Forge, Runs on Atlassian:
Smart Tables is a Forge-native app and has earned the Runs on Atlassian badge, meaning it meets Atlassian’s requirements for apps that keep data within Atlassian infrastructure.
Why do native Confluence tables eventually reach their limits?
Native Confluence tables are excellent for documentation and lightweight tracking.
Most teams don’t just want to find information anymore; they want to answer questions like:
- Which projects are overdue and over budget?
- Which high-priority risks still don’t have an owner?
- Which assets expire next quarter by department?
- What’s the average completion rate per team?
Smart Tables already solves many of these scenarios through sorting, grouping, filtering, search, pivot tables, charts, or formulas.
SQL Views don’t replace those features. They complement them.
For everyday work, filtering, sorting, or grouping is often the fastest solution.
When datasets become larger, or questions require multiple conditions, aggregations, or advanced reports, SQL Views provide another layer of analysis without leaving Confluence.
Why SQL views?
Many teams already think in queries, even if they’re clicking through filters instead of writing SQL.
SQL Views make those questions easier to answer.
They allow you to:
- Query multiple conditions in a single request.
- Aggregate data using counts, totals, averages, and calculations.
- Create other views without duplicating your tables.
- Generate multiple perspectives from one dataset.
- Save SQL Views for future reporting.
The biggest advantage isn’t writing SQL; it’s avoiding duplicate tables across your page.
One dataset and multiple views
One Smart Table can support multiple teams and use cases without filling your Confluence page with separate macros or duplicate tables.
With Tab Mode, you can display different views of the same Smart Table as tabs within a single macro. Each team can create its own SQL View based on the same source data and switch between views without leaving the table.
For example:
- Project Managers can monitor overdue tasks and project status.
- Finance can focus on budget variances and spending.
- Leadership can review high-level portfolio summaries.
- Engineering can track sprint progress and blockers.
- Operations can review resource allocation.
The source data stays the same. Each team simply gets the view it needs, all organized within one Smart Table.
AI mode makes SQL easy for everyone
SQL isn’t difficult for technical users, but for everyone else, AI Mode eliminates the learning curve.
Instead of writing a query, simply describe the information you’re looking for.
Examples include:
- Show all overdue tasks assigned to Marketing.
- Display projects exceeding their planned budget.
- Count high-severity risks grouped by owner.
- List assets that expire within the next 30 days.
AI Mode translates your request into SQL, automatically creates the SQL View, and lets you review or edit the generated SQL query if you’d like.
Technical users save time, and non-technical users gain capabilities they never had before.
Use case: How to manage Company Risk Register with SQL query?
Imagine a Project Manager Officer (PMO) team managing a company-wide risk register.
For daily work, they use:
- Sorting to prioritize risks by status.
- Grouping to organize risks by team or category.
- Global Search to locate a specific risk by ID or description.
- Filters to review only open, active risks.
- Pivot Tables to summarize risk counts by severity.
- Charts to visualize exposure across teams.
As the register grows, different stakeholders need different perspectives. Rather than maintaining multiple copies of the same table, the team creates SQL Views.
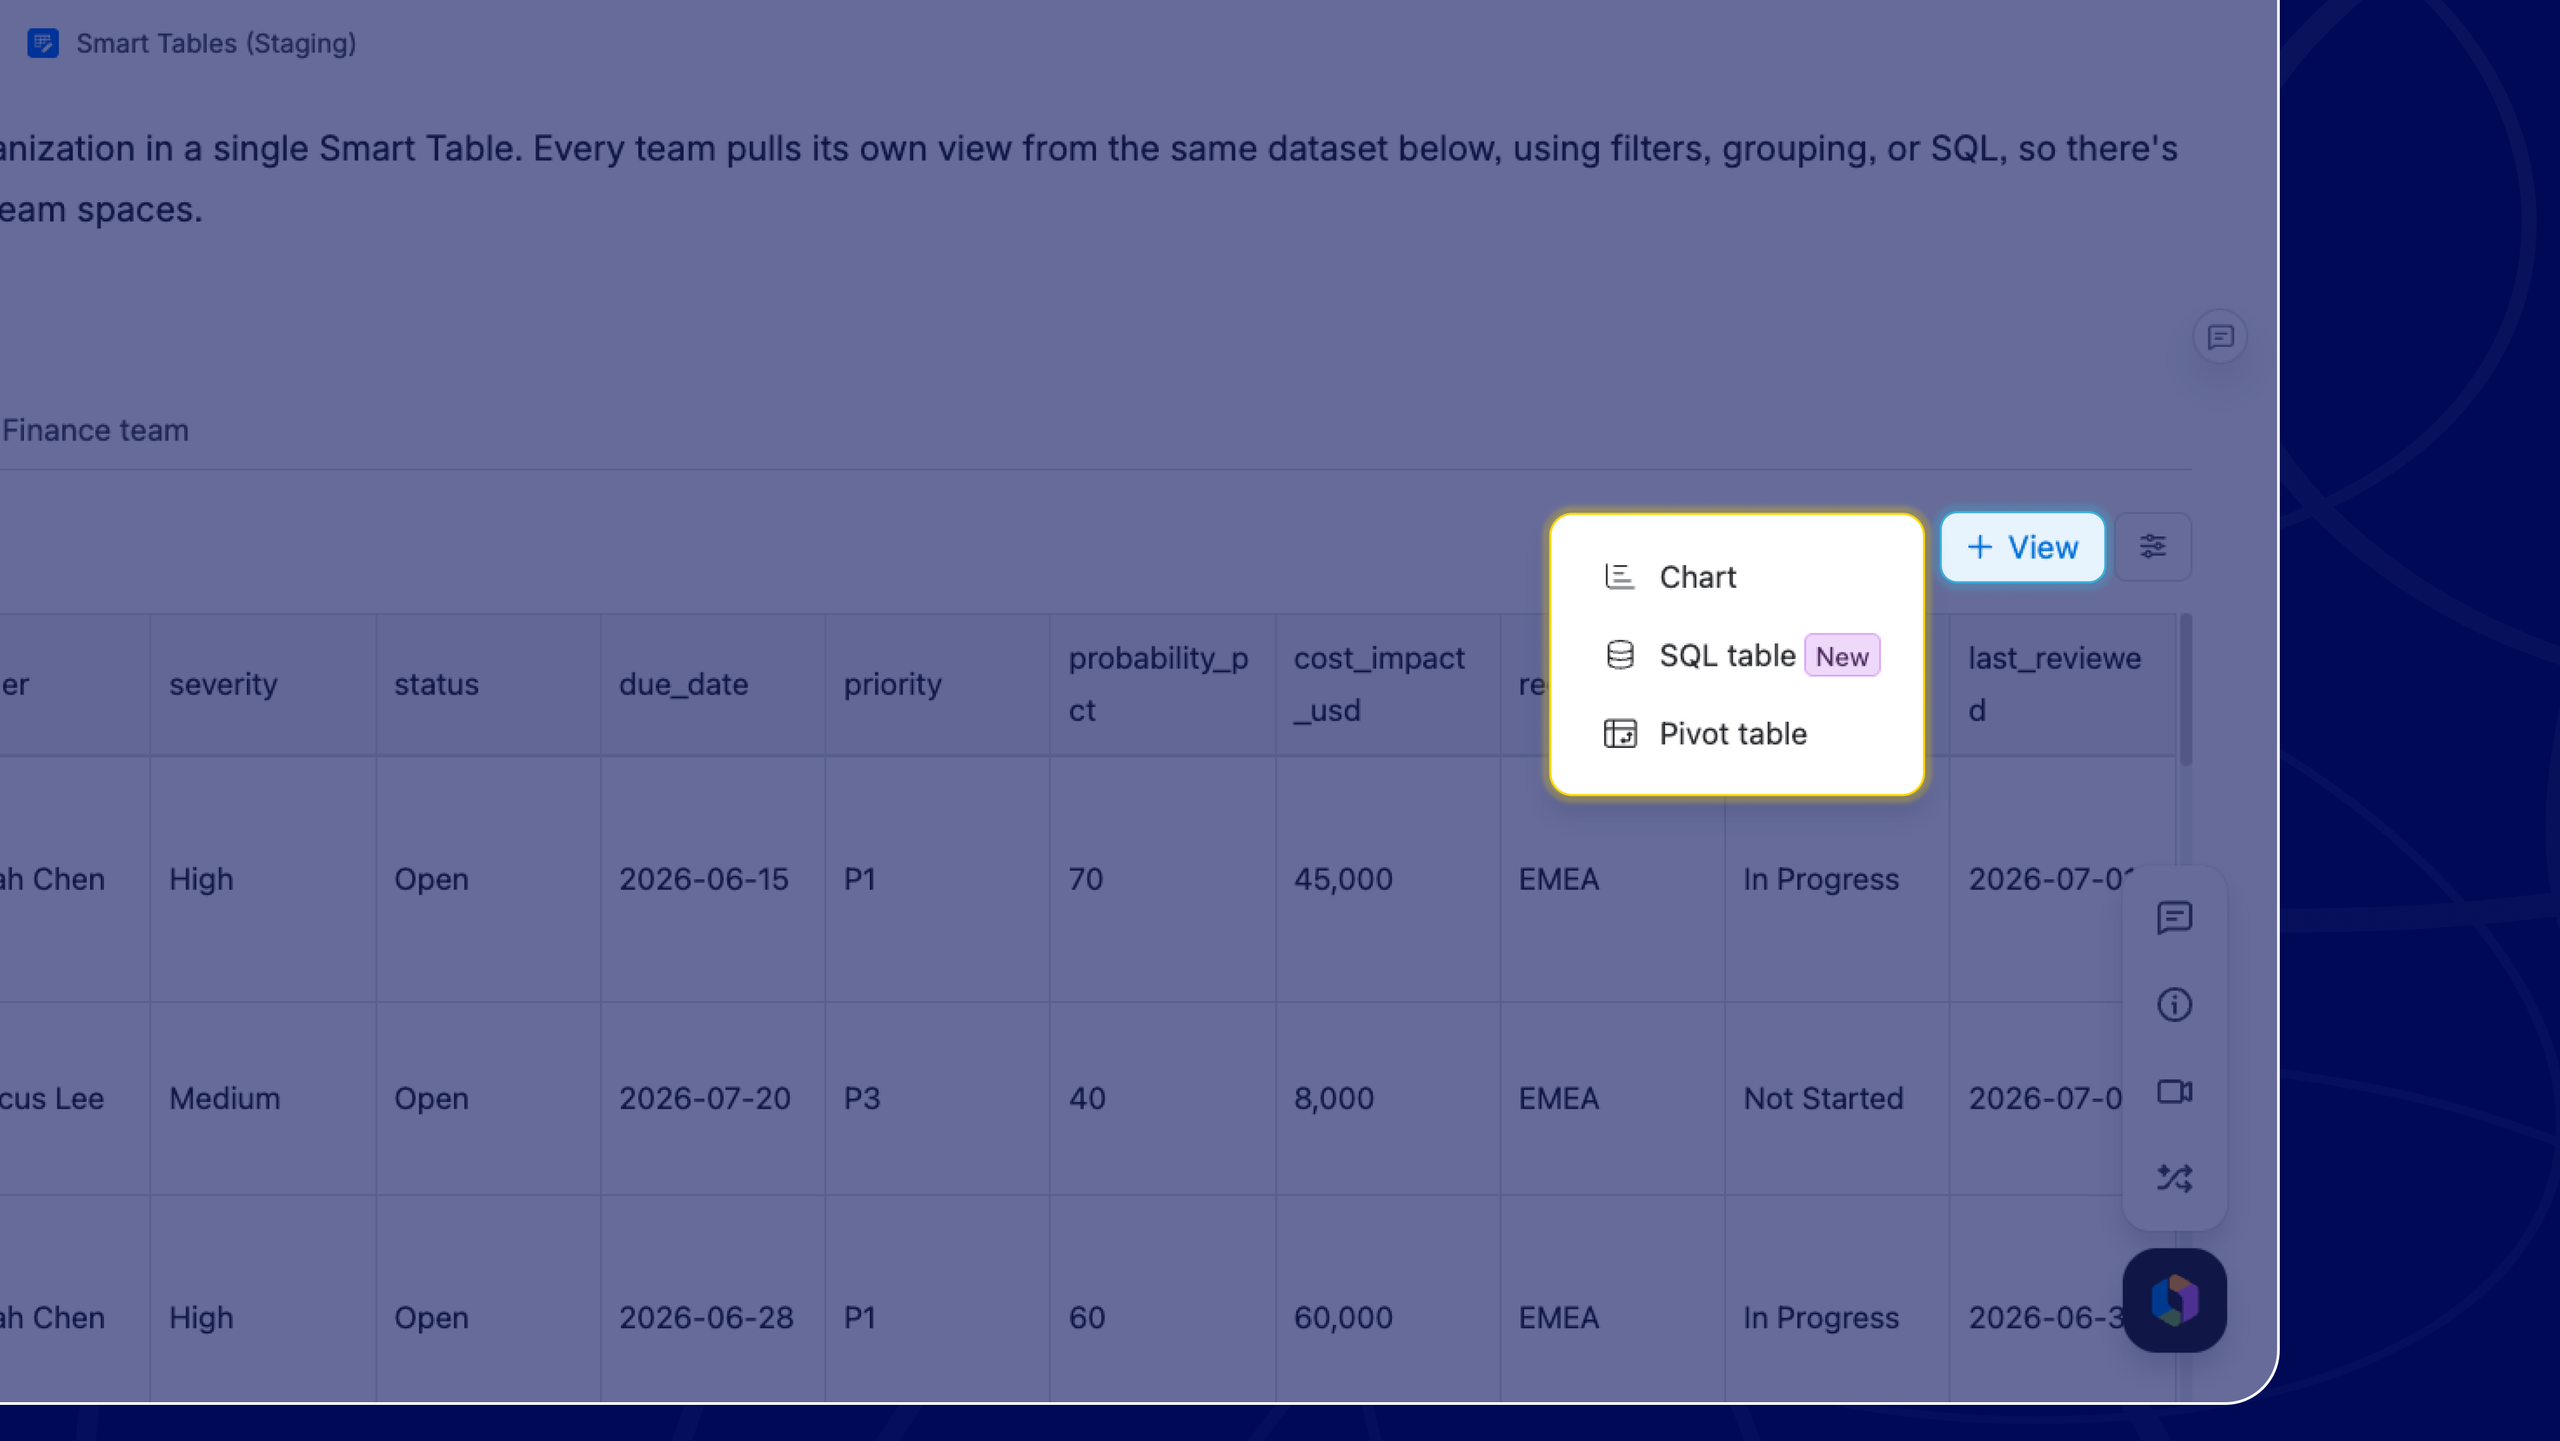
The Finance team creates a view showing every open risk with a cost impact above $20,000:
“Show me all risks where cost_impact_usd is greater than 20000, and status is Open.”
The Project Office creates a view of overdue, still-open risks to make sure they’re caught and acted on quickly.
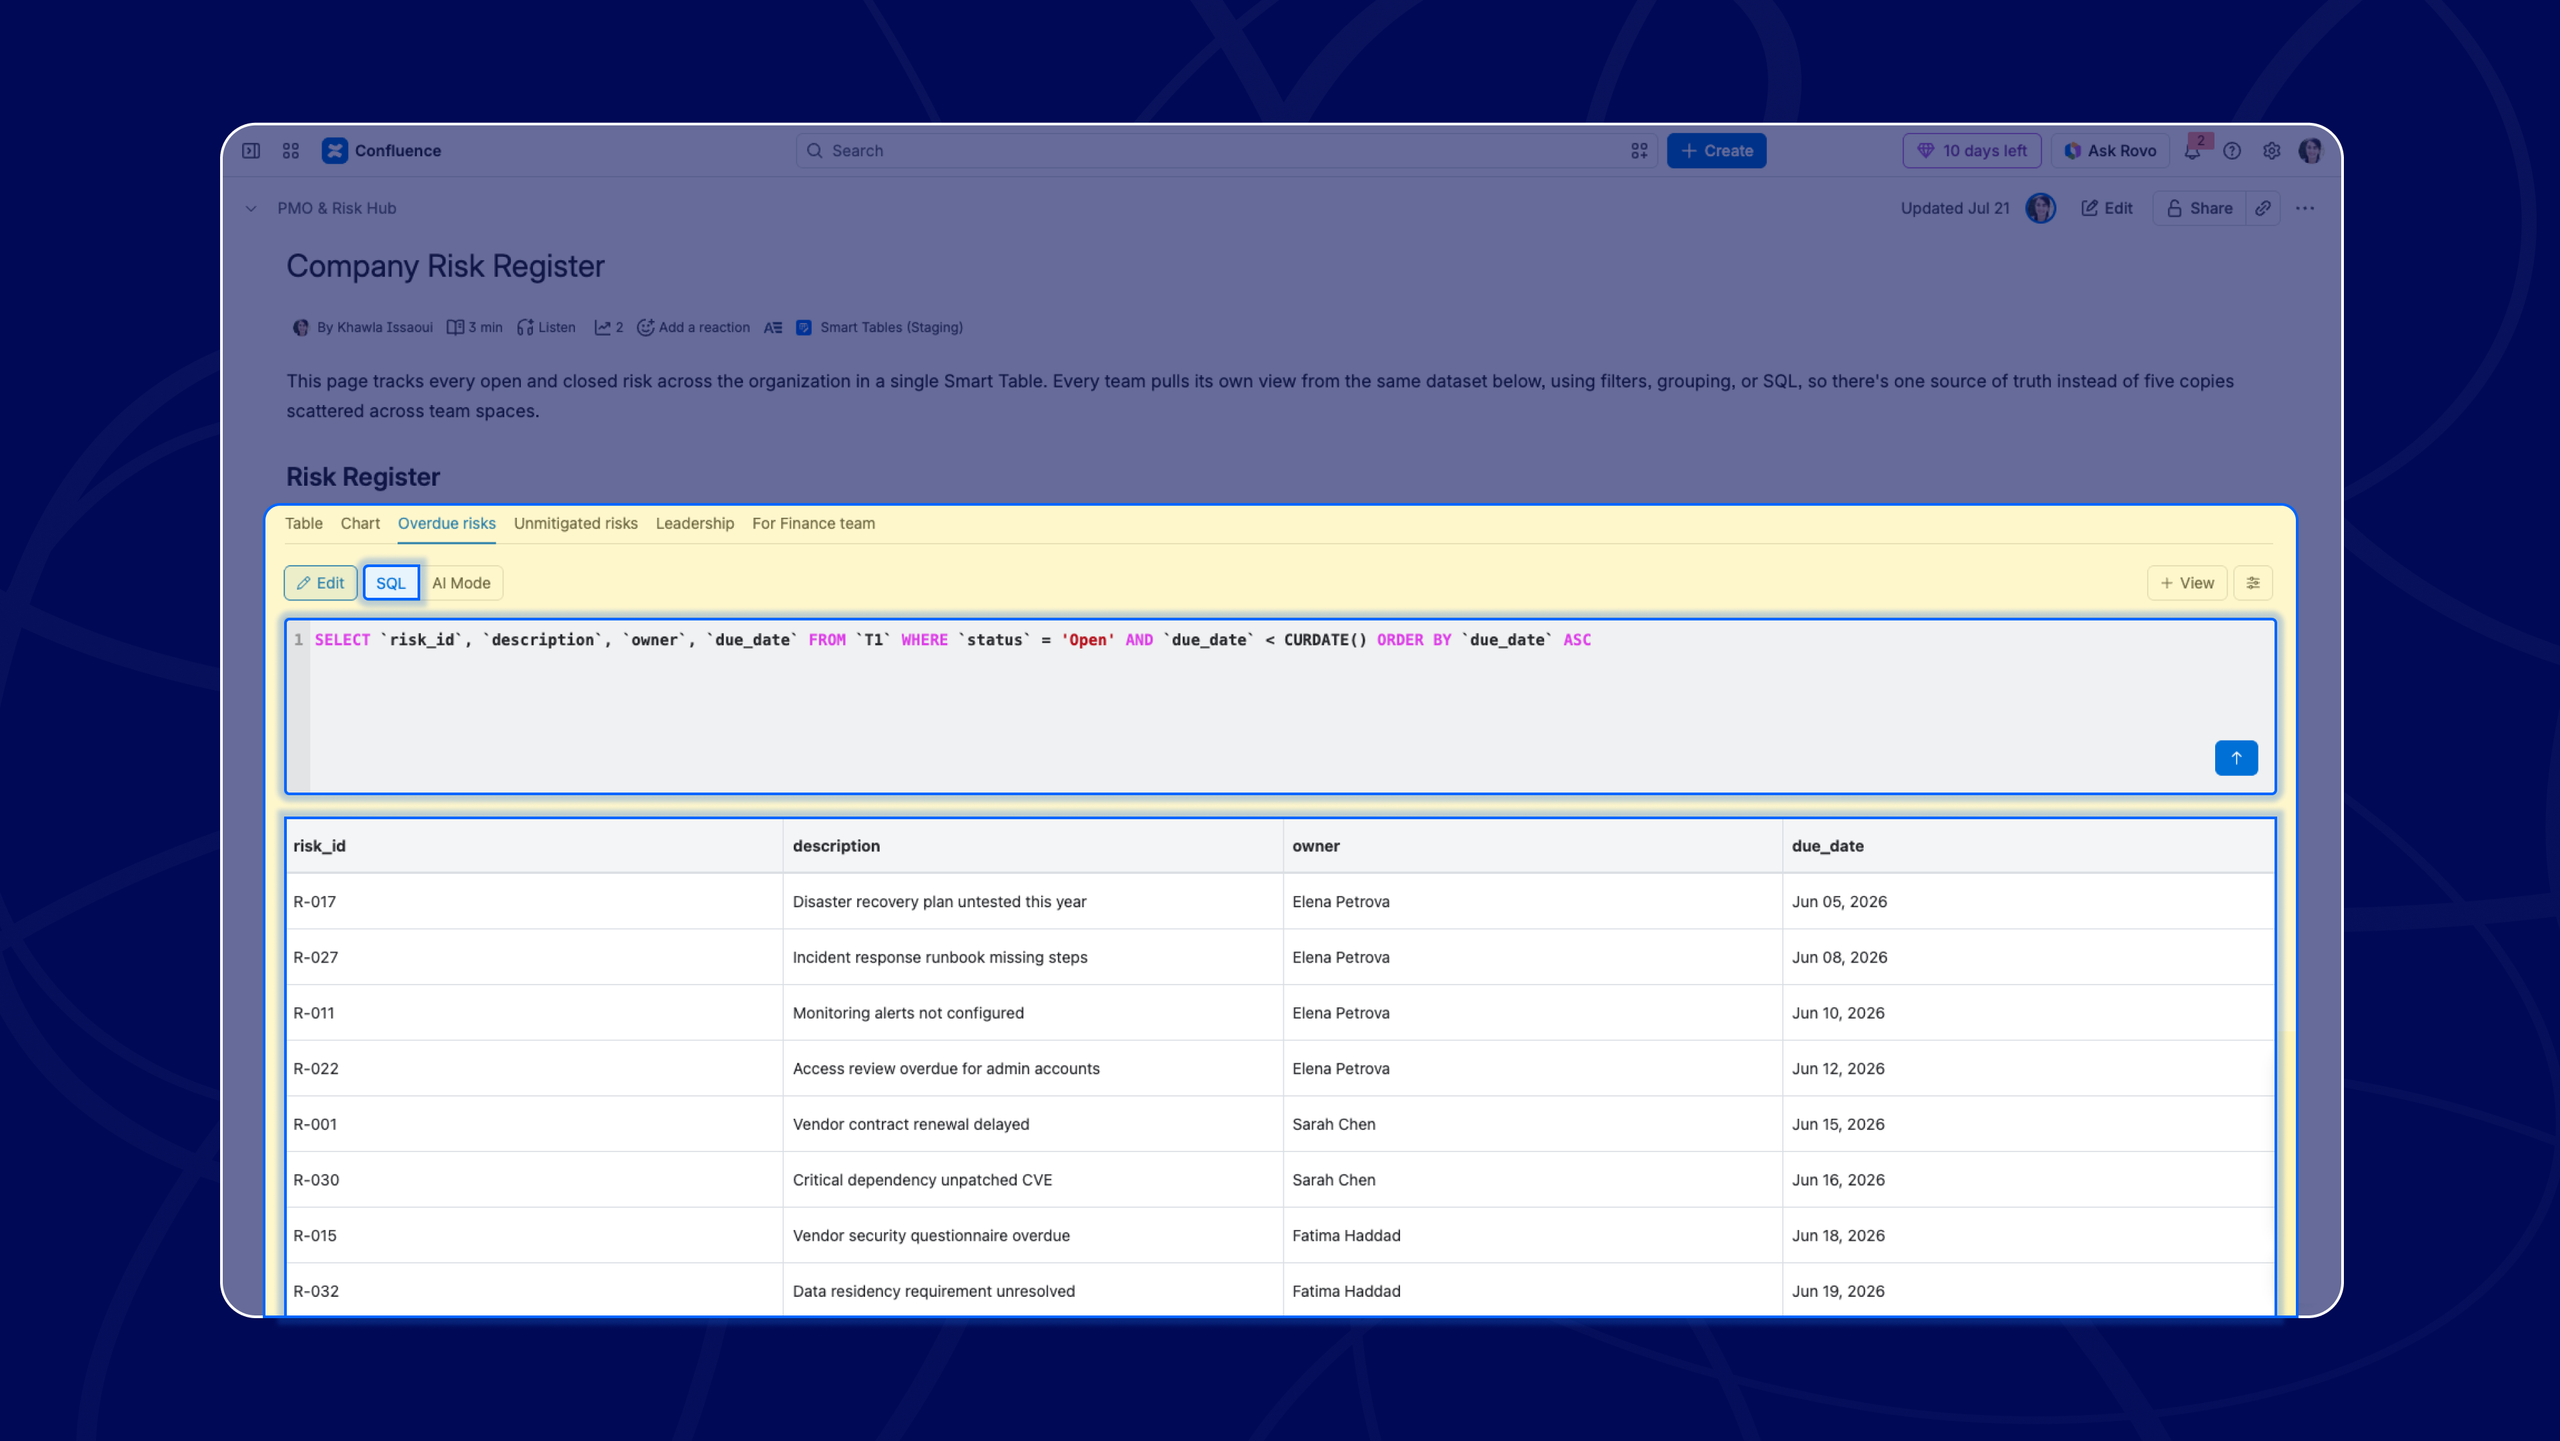
SELECT `risk_id`, `description`, `owner`, `due_date` FROM `T1`
WHERE `status` = 'Open' AND `due_date` < CURDATE() ORDER BY `due_date` ASC
Engineering and IT/Ops review a view of unmitigated risks, filtering to anything where mitigation hasn’t started yet, so effort goes where it’s needed first.
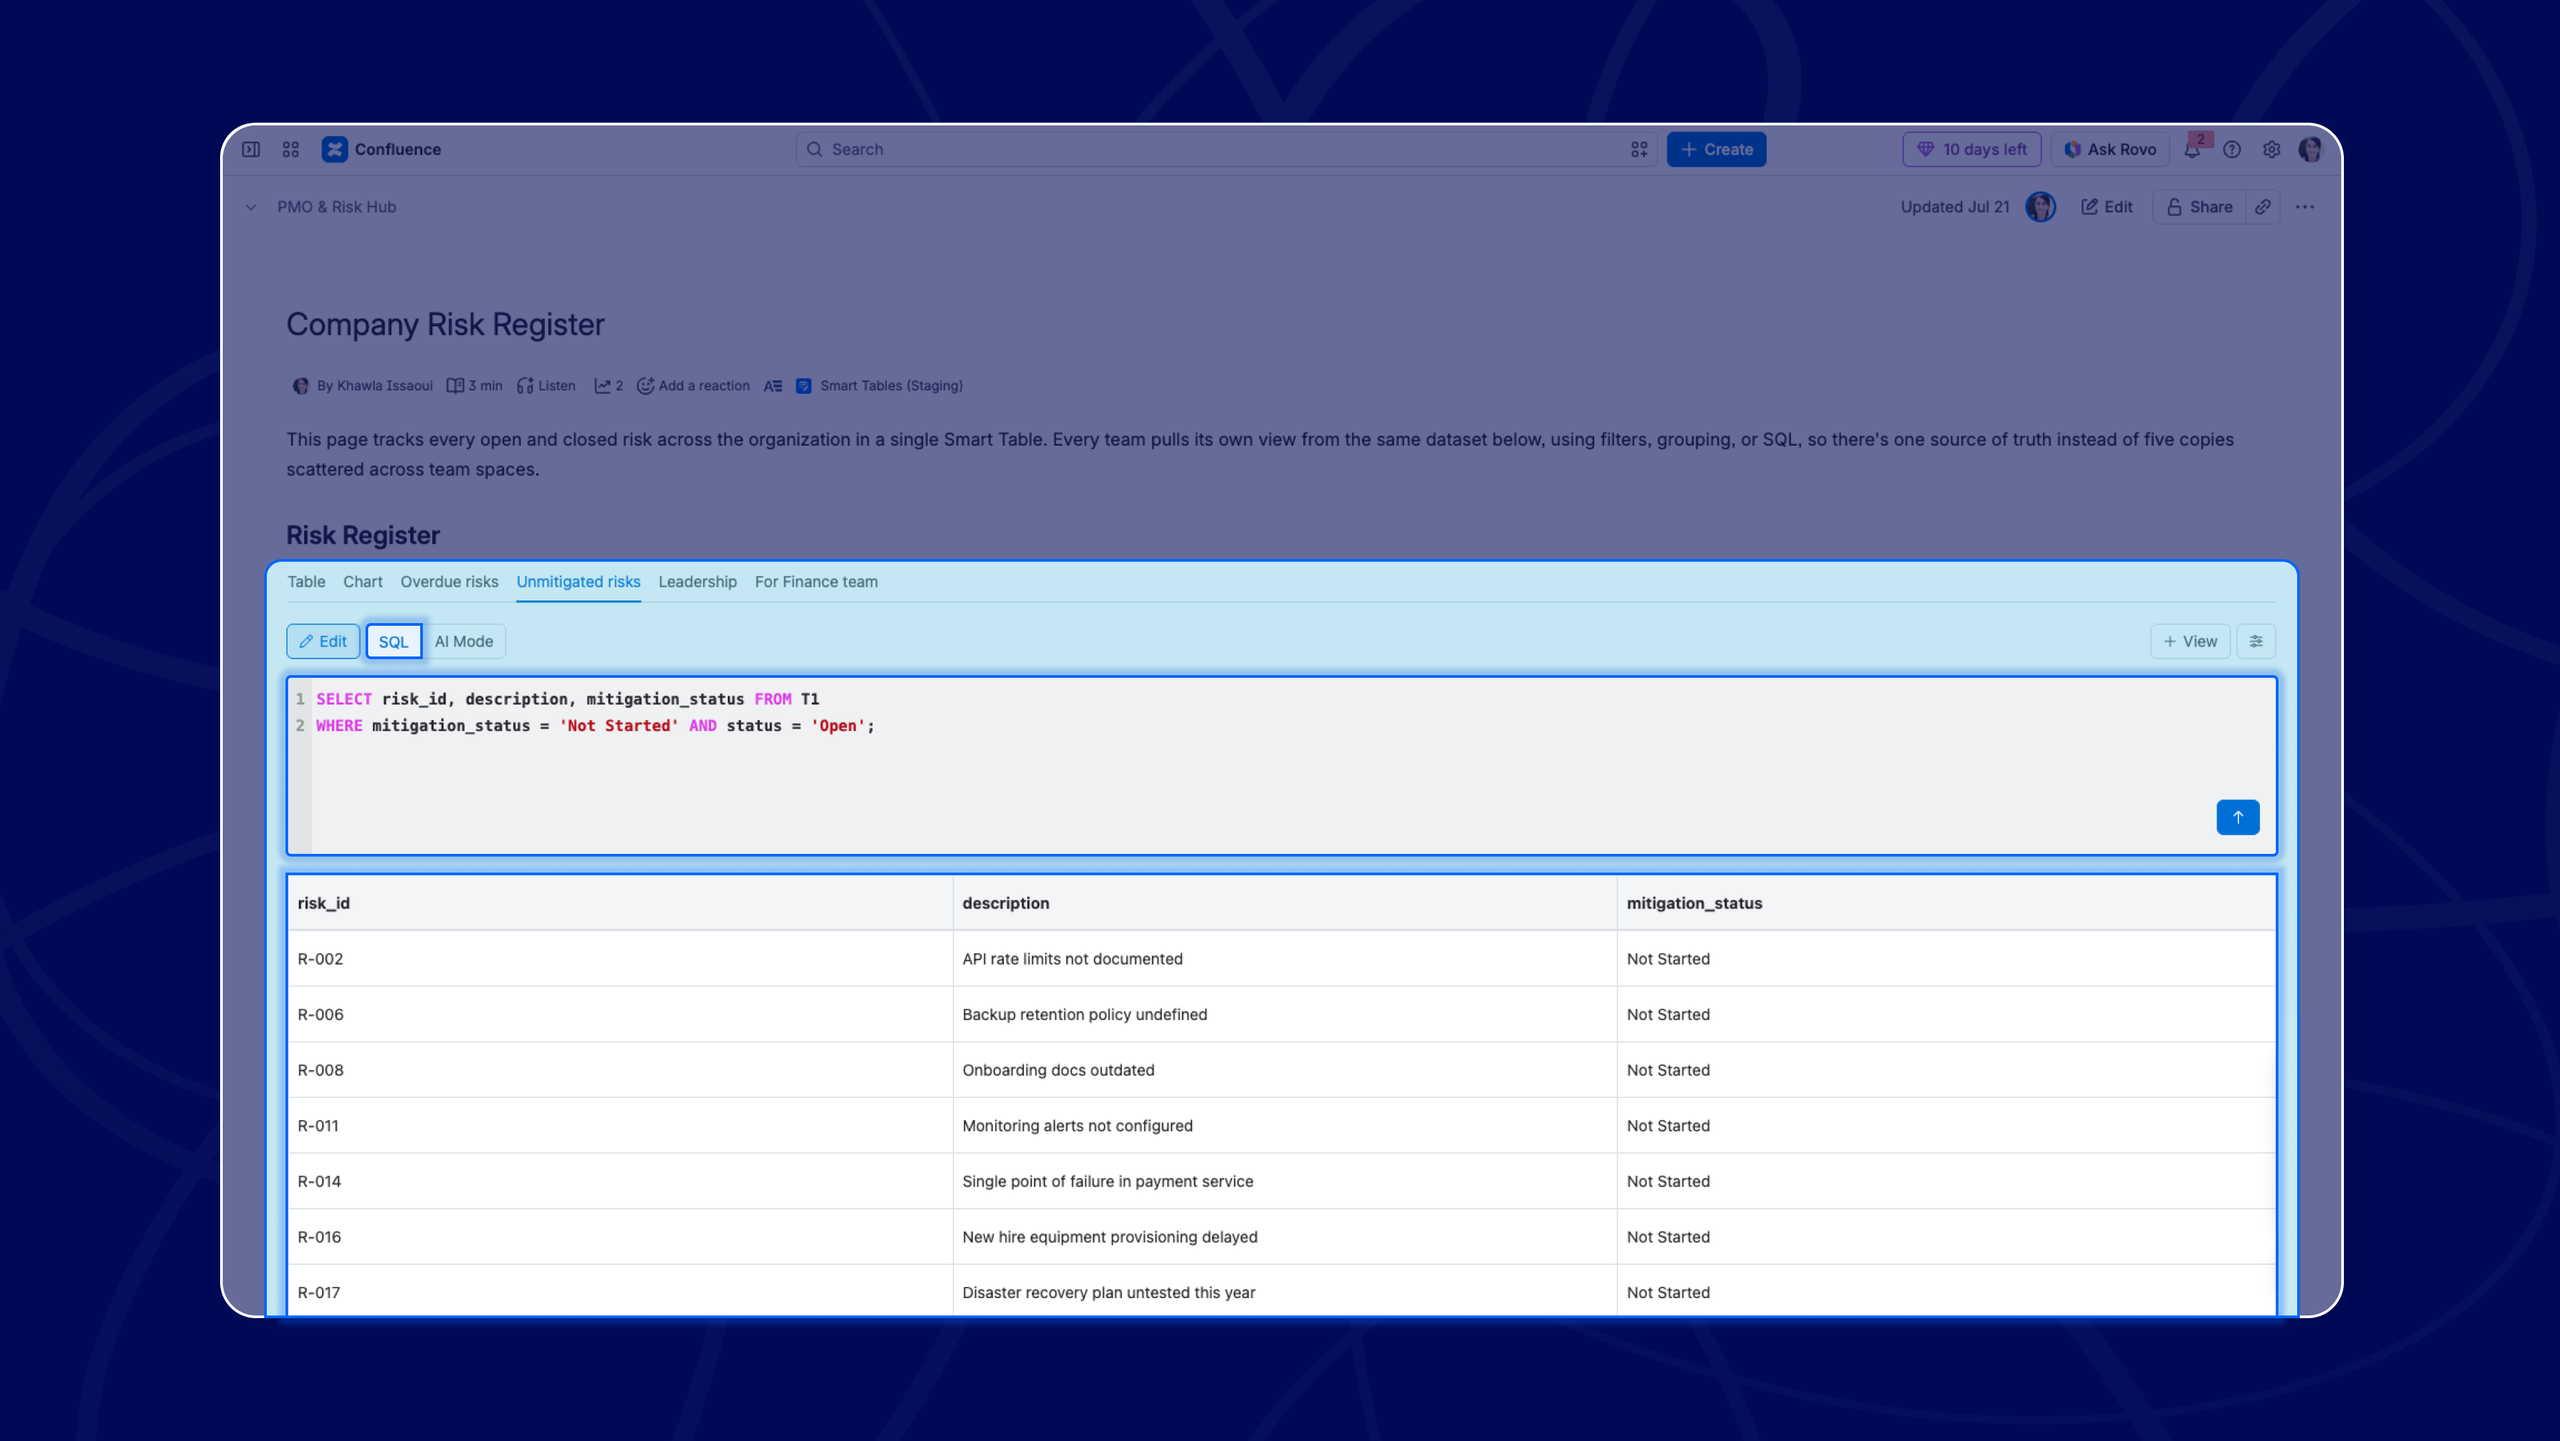
SELECT risk_id, description, mitigation_status FROM T1
WHERE mitigation_status = 'Not Started' AND status = 'Open';
Every SQL View is based on the same Smart Table, ensuring everyone sees the latest information without duplicating or manually maintaining data.
How to use SQL?
If you’re new to Smart Tables, you’ll find the interface intuitive and easy to navigate. Whether you’re starting from scratch or importing an existing Excel file, you can begin organizing and analyzing your data in just a few clicks.
As your dataset grows, use familiar features such as sorting, grouping, global search, filters, formulas, pivot tables, and charts to explore your data from different perspectives.
When you need a more advanced view, simply click + View and select SQL table. From there, you can write your own SQL query or switch to AI Mode and describe the results you want in plain language. Smart Tables generates the SQL query for you and creates an adjustable SQL View alongside your existing Table, Pivot Table, and Chart views.
You can switch between these views at any time without modifying your original dataset, allowing different teams to work from the same data while focusing only on the information that’s relevant to them.
Why does this matter?
Every team works differently, and some questions can be answered with a simple filter.
Others require grouping, a pivot table, or a chart.
And now, as your data grows and your questions become more complex, SQL Views offer another way to explore the same information without exporting data or leaving Confluence.
Instead of choosing among spreadsheets, databases, and Confluence, Smart Tables brings them together into a single view on one page.
Key takeaways
SQL Views expand what teams can do with data in Confluence by adding powerful querying capabilities to the Smart Tables experience. Rather than replacing existing tools like filtering or grouping, they provide more ways to explore larger datasets and answer more complex questions.
- Analyze large Confluence tables more efficiently with SQL queries designed for advanced reporting and data exploration.
- Keep one source of truth by creating multiple SQL Views from the same Smart Table instead of maintaining duplicate tables for different teams.
- Generate SQL queries with AI by describing the data you want in plain language, no SQL expertise required.
- Combine SQL Views with existing Smart Tables features, including formulas, sorting, grouping, global search, pivot tables, and charts.
- Work entirely inside Confluence Cloud, with Smart Tables running natively on Atlassian Forge for a seamless and secure experience.
- Give every team the view they need, whether they’re tracking projects, reviewing budgets, managing assets, or monitoring operational data.
Frequently asked questions
Can you use SQL with Confluence tables?
Native Confluence tables don’t support SQL queries. Smart Tables adds SQL Views, allowing you to query table data directly inside Confluence without exporting it to another tool.
Do I need SQL knowledge to use SQL views?
No! Smart Tables includes AI Mode, which automatically converts plain-language requests into SQL queries. You can use the generated query as-is or edit it after running it.
When should I use SQL views instead of filters or grouping?
Filtering, sorting, grouping, and global search are the quickest way to work with everyday tables. SQL Views are best suited for larger datasets or more advanced reporting scenarios that require multiple conditions, aggregations, or complex queries.
Can different teams create different views from the same table?
Yes! One Smart Table can support multiple SQL Views, allowing project managers, finance teams, executives, and operations teams to work from the same dataset while focusing only on the information relevant to them.
Can I save and reuse SQL queries?
Yes! SQL queries are saved as SQL Views, making it easy to return to the same analysis without rebuilding filters or writing the query again.
Can SQL Views be used alongside Pivot Tables and Charts?
Yes! SQL Views become another view type within Smart Tables and work alongside Table, Pivot Table, and Chart views. You can switch between them at any time while keeping the same underlying dataset.
Does SQL work with imported Excel and CSV data?
Yes. After importing data from XLSX or CSV to Smart Tables, you can query it using SQL Views, build pivot tables, create charts, or continue working with the rest of Smart Tables’ features.
Is Smart Tables built on Atlassian Forge?
Yes! Smart Tables is a Forge-native Confluence app, meaning it runs directly on Atlassian’s cloud platform and integrates with the Confluence experience.
Which teams benefit most from SQL Views?
SQL Views are ideal for any team managing structured data in Confluence, including Project Management Offices (PMOs), Product teams, Engineering, IT Operations, Finance, HR, Compliance, and Operations. They’re particularly valuable when datasets become too large or complex for standard filtering and grouping alone.
ConfluenceLearningOnboarding