Confluence KPI tracking issues and how to fix them
Most teams start using Confluence tables with high hopes. They create pages to track KPIs, monitor performance, and share updates across teams. At first, it works.
But over time, things break down.
Data gets outdated, pages get duplicated, and metrics such as KPI lose consistency. Eventually, teams move their tracking back to spreadsheets.
This isn’t a team problem. It’s a tooling gap.
And it becomes especially visible as organizations try to scale Confluence KPI tracking and project management in Confluence.
The problem with native Confluence Tables
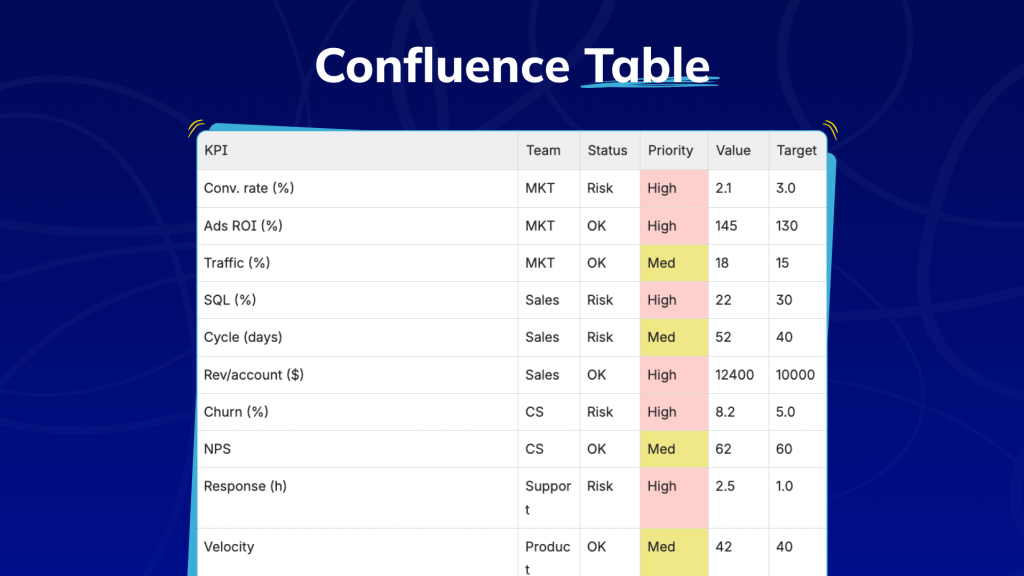
For some teams, a typical KPI table in Confluence looks like this: rows for campaigns or initiatives, columns for owners, deadlines, statuses, and metrics. It’s a reasonable starting structure. But the moment the dataset grows, the cracks appear fast.
Native Confluence tables offer limited filtering and grouping capabilities. You can’t easily filter by owner or status, group by team or priority, or dynamically sort large datasets. Updates rely entirely on people remembering to come back and edit the page.
So teams compensate in predictable ways, duplicating pages for different views, exporting to spreadsheets, and maintaining multiple versions of the same dataset just to answer simple questions.
Smart Tables: a structured layer inside Confluence
Smart Tables addresses the root limitation directly. Rather than treating Confluence pages as documents with embedded tables, Smart Tables turns those tables into interactive, structured datasets without requiring teams to leave the workspace.
The shift sounds subtle. Its effects are not.
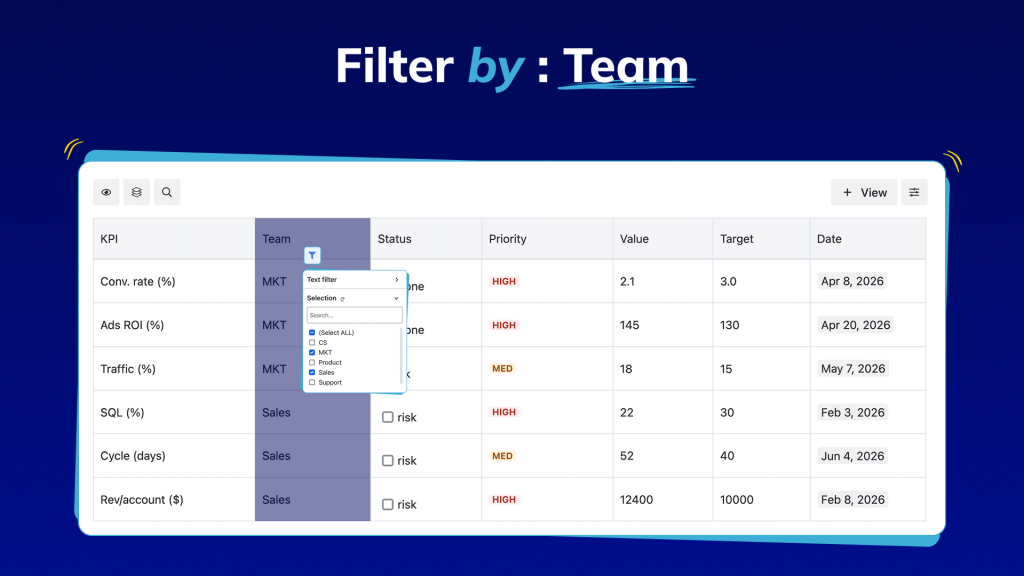
- Filtering
Each stakeholder sees only their slice of data, by team, status, quarter, or priority. What makes this powerful is that filters are persistent, reusable views built on top of a consistent schema, so they never break and always reflect live data. One table replaces what used to require multiple duplicated pages, each drifting out of sync.
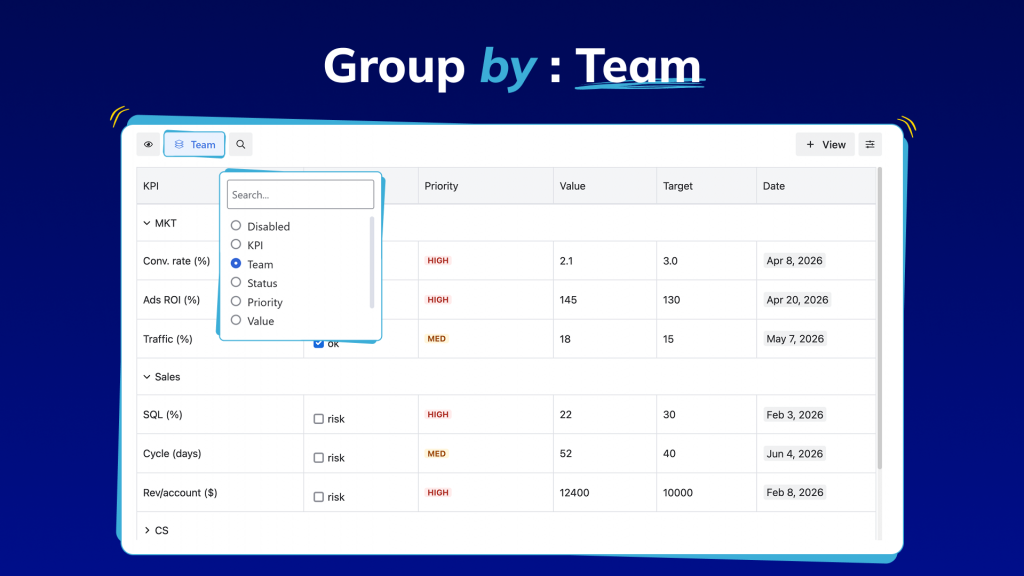
- Grouping
As KPI data grows, a long flat list of metrics becomes impossible to scan for different teams, statuses, and priorities all mixed together with no visual hierarchy. Grouping solves this by organizing data into meaningful categories on the fly. Group by team to see how each department is performing at a glance. Group by status to instantly separate what’s on track from what’s at risk. The data doesn’t change just how you navigate it.
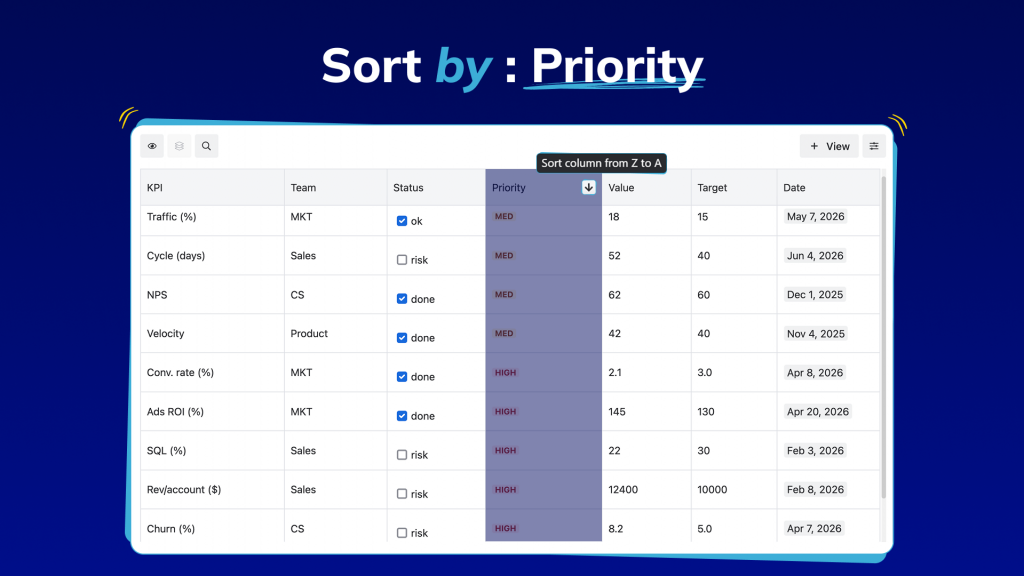
- Sorting
Without sorting, the answers to the most critical questions, which KPIs are underperforming, which campaigns are delivering, and what needs immediate attention, are buried inside the data. Sorting brings them to the surface instantly. Sort by lowest performance to identify risks before they escalate. Sort by highest impact to highlight wins worth sharing. Sort by deadline to stay ahead of what’s coming. Any field, any direction, actionable in seconds.
The foundation of effective Smart Tables tracking is a consistent data structure. Each row represents a single unit of measurement: a campaign, a sprint, or a product initiative. Each column is a defined, standardized field: metric name, owner, team, status, priority, reporting period, performance value.
When every row follows the same schema, the entire table becomes a queryable dataset; that consistency is what transforms a table from a formatted list into a system.
The Atlassian Teamwork Collection: tools becoming a system
With the Atlassian Teamwork Collection, the company is making a deliberate architectural shift: away from individual apps used side by side toward a unified system where planning, documentation, and execution are deeply connected.
This reflects something real about how work actually happens. A decision made in a Confluence page triggers a project tracked in Jira. A sprint outcome updates a KPI that lives in a doc. When tools are isolated, context is lost at every handoff. The Teamwork model is designed to close those gaps.
Even within a better-connected Atlassian ecosystem, Confluence had a specific problem: the moment documentation became operational, tracking deliverables, monitoring KPIs, and managing live project data, its tables became a liability. Static by default, prone to drift, dependent on manual exports. The Teamwork vision needed Confluence to do more.
The bigger shift: from documentation to operations
Together, Smart Tables and the Teamwork Collection represent a broader transformation in how teams manage work.
| Before | After |
|---|---|
|
|
|
|
|
|
|
|
Reporting consistency, one of the most persistent pain points in project management, gets addressed at the source. KPIs are defined once in a structured format in Confluence. Every stakeholder sees the same data in the same format. Reports are generated from the live source, not assembled from exported fragments.
Just as importantly, this shift doesn’t require teams to change how they work inside Confluence.
Smart Tables works effectively with native Confluence macros and elements, including smart links, attachments, code snippets, decision macros, and user mentions. Tables remain fully integrated with the rest of the page, whether it’s linking to a Jira issue, displaying media, or exporting to PDF.
What this means in practice
A team lead filters the KPI table in Confluence to view only their team’s metrics. A manager groups data by status to spot risks, while an executive sorts by performance to identify priorities before a review. No exports, no duplicate reports, no need to search for the latest version.
This is the experience that Smart Tables enables and that the Atlassian Teamwork Collection is designed to support.
Confluence KPI tracking isn’t about adding more tools or pages. It’s about making existing data structured, consistent, and interactive, with Smart Tables providing the foundation and Atlassian delivering the system that connects it all.
ConfluenceDocumentationExcelPivot tableReal time CollaborationReportingSales trackingTables