Dashboards in Confluence for Project Managers: create clear project status

Your project team tracks tasks in Jira.
It maintains project documentation in Confluence and shares progress updates with stakeholders.
It also supports dashboards in Confluence.
But when it’s time for a project status meeting, someone still has to collect the numbers, update the tables, calculate the totals, and prepare a report everyone can understand.
For Project and PMO Managers, the challenge isn’t just tracking project information. It’s turning that information into a clear project status dashboard without rebuilding the same report every week.
If your organization already uses Confluence, you can keep project reporting alongside your documentation. Additionally, you can use Smart Tables to make the data easier to filter, analyze, and visualize.
TL; DR
Dashboards in Confluence help teams bring project status, milestones, budgets, risks, and progress reports together.
With Smart Tables for Confluence, you can create interactive project trackers and apply advanced filters.
Also, the table’s analytical views stay connected to source data.
This reduces the need to manually recreate reports whenever the table changes.
Why does project status reporting in Confluence become difficult?
Confluence is a place for project plans, meeting notes, decisions, and stakeholder reports.
Meanwhile, Jira helps teams track the individual tasks and issues involved in project delivery.
But stakeholder reporting often requires something different.
A Project Manager might need to answer:
- How many tasks are still in progress?
- Which milestones are overdue?
- How is the project budget being spent?
- Which teams have the highest workload?
- What has changed since the previous status meeting?
Some answers might already exist in Jira. Others may live in Confluence tables, project budgets, or manually maintained trackers.
The problem appears when teams repeatedly copy information into new reports, create separate spreadsheets for calculations, or maintain multiple versions of the same data.
Confluence provides native project reporting options, including project status report templates and Jira-connected reports.
For structured data that teams maintain in Confluence, Smart Tables adds filtering, calculations, and analytical views that make those reports easier to explore.
Here’s how to build a useful project status dashboard in six steps.
Step 1: Define the project KPIs stakeholders actually need
Before building a dashboard, decide which project information your audience needs to see.
A Project Manager may need detailed task information, while a PMO Director or executive stakeholder may only need a summary of overall progress, budget, and risks.
Start with a few reporting categories:
| Reporting category | Example KPIs | Why it matters |
|---|---|---|
| Project progress | Completed tasks, open tasks | Monitor delivery |
| Timeline | Upcoming milestones, overdue tasks | Identify delays |
| Budget | Planned budget, actual spending | Track financial performance |
| Workload | Tasks by team or owner | Understand work distribution |
| Risks | Open risks, high-priority issues | Identify areas needing attention |
You don’t need every possible metric in the same dashboard.
For example, a weekly project status report might focus on task completion, deadlines, and risks.
A quarterly PMO report may need additional financial information, project comparisons, and workload summaries.
The goal is to define a consistent set of KPIs that helps stakeholders understand what’s happening and where attention is needed.
Step 2: Create a structured project tracking table in Confluence
Once you’ve identified your KPIs, organize the information into a table.
Instead of creating a new reporting table for every meeting, maintain one structured dataset that can support different reporting needs.
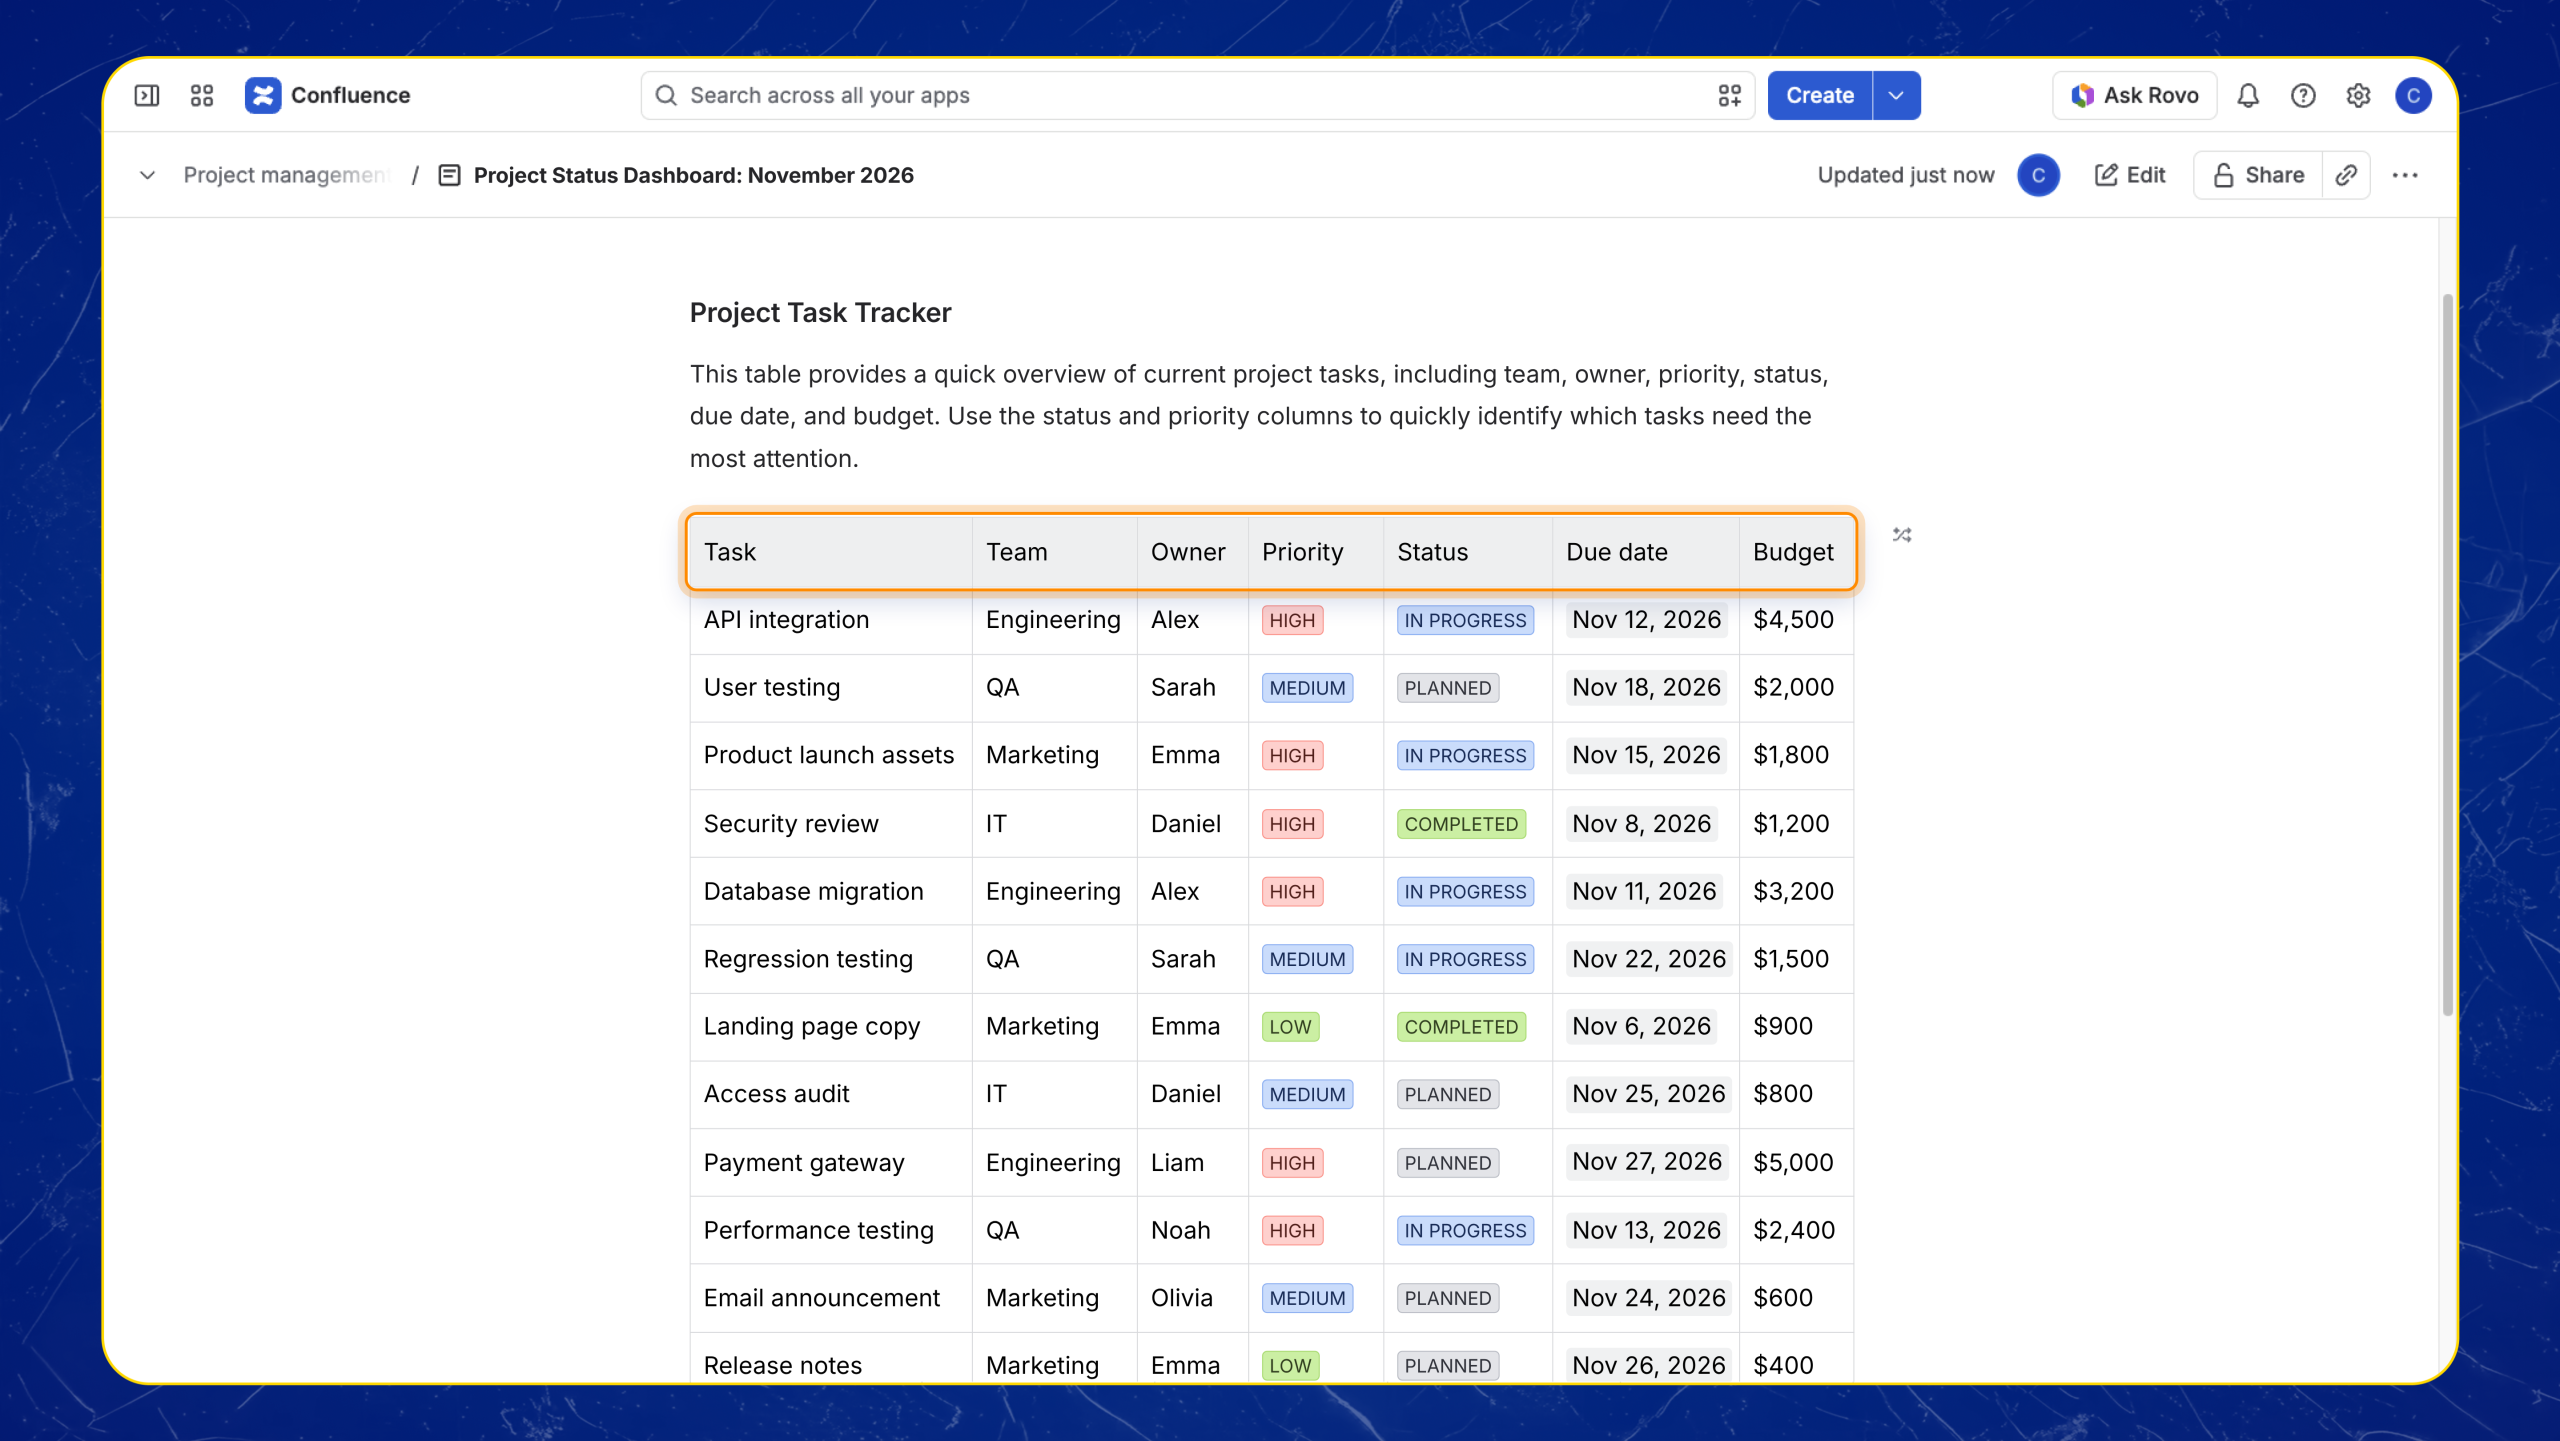
For example, a project tracking table could contain:
| Task | Team | Owner | Priority | Status | Due date | Budget |
|---|---|---|---|---|---|---|
| API integration | Engineering | Alex | High | In progress | Nov 12 | $4,500 |
| User testing | QA | Sarah | Medium | Planned | Nov 18 | $2,000 |
| Product launch assets | Marketing | Emma | High | In progress | Nov 15 | $1,800 |
| Security review | IT | Daniel | High | Completed | Nov 8 | $1,200 |
These values are illustrative, but they show how one table can contain information useful for several different reporting questions.
With Smart Tables for Confluence, you can create a new table, import data from Excel or CSV, or convert an existing Confluence table.
This allows teams to build on information they’ve already organized rather than starting from scratch.
You can also edit table cells directly using the Smart Tables editor.
Learn how to add a Smart Table in Confluence.
Step 3: Filter and organize project information for different stakeholders
A project tracking table might contain dozens or hundreds of rows.
That’s useful for maintaining detailed information, but not every stakeholder needs to see every task.
For example:
- A Project Manager wants to identify overdue tasks.
- A Team Lead wants to review tasks assigned to their department.
- A PMO Manager wants to compare work across teams.
- An executive stakeholder wants to focus on high-priority risks.
Instead of duplicating the table for each audience, use filters and sorting to narrow down the information.
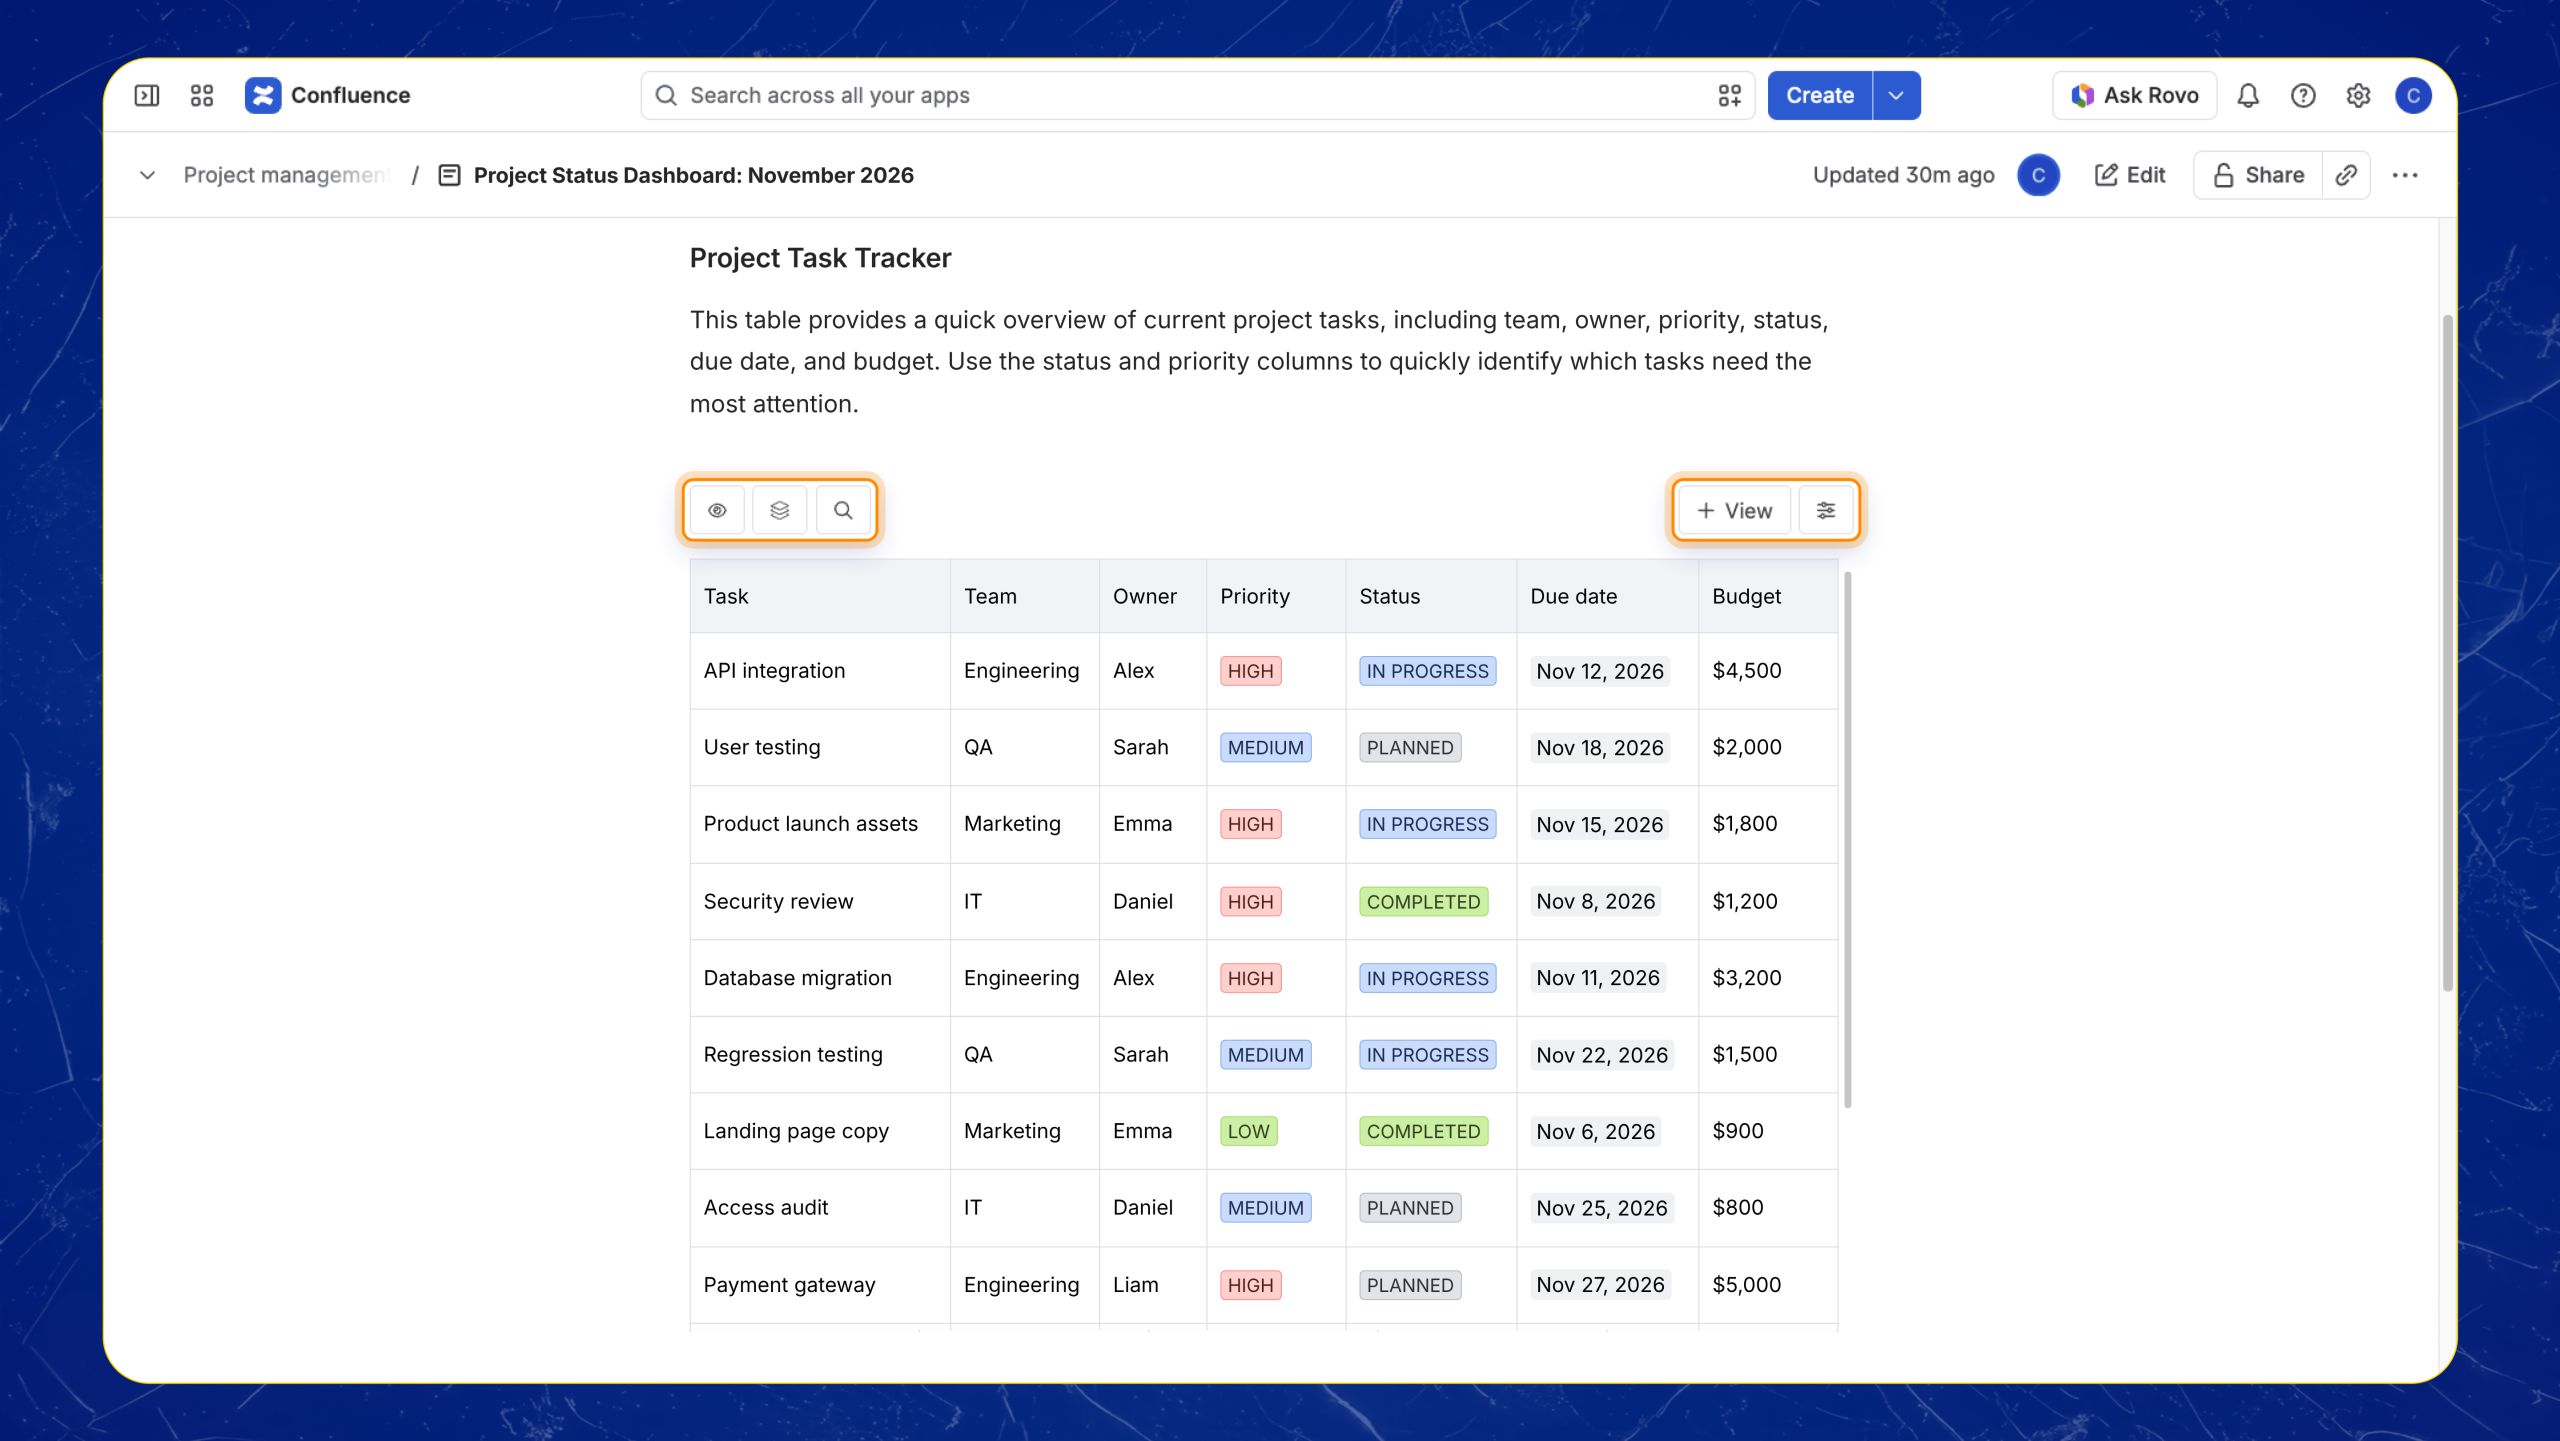
Smart Tables provides advanced table filtering, allowing users to filter rows and columns using different criteria.
For example, you could:
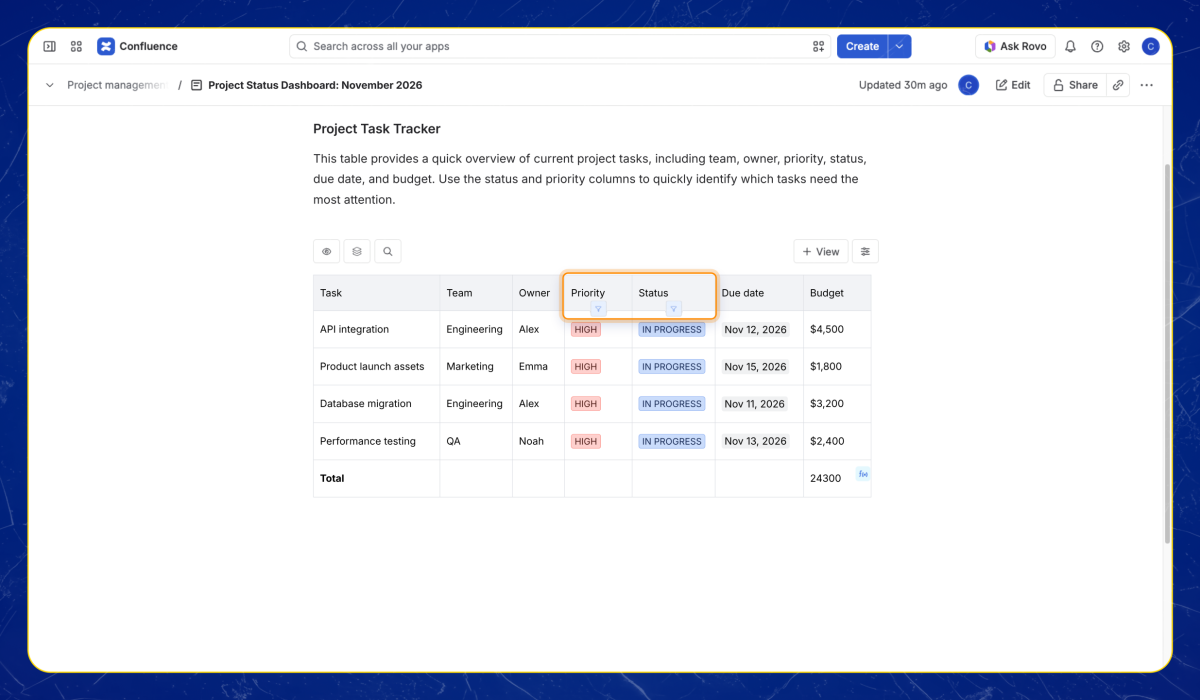
- Filter the Status column to show only tasks marked In progress.
- Filter Priority to show High.
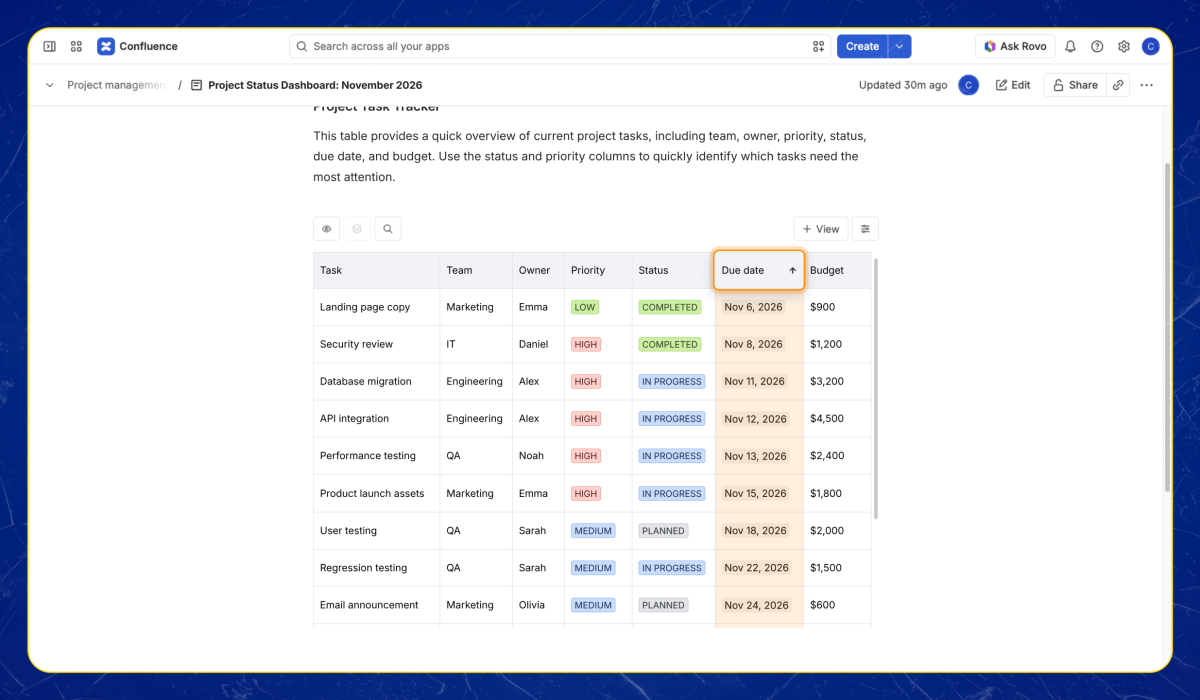
- Sort the remaining tasks by due date.
For more complex reporting needs, Smart Tables also supports SQL views, allowing Project Managers to query their data using SQL or generate queries with AI. This is particularly useful when combining multiple conditions, performing calculations, or creating more advanced views of project information without modifying the original table.
For example, a PMO Manager could use SQL to identify high-priority tasks that are still in progress and have a planned budget exceeding $3,000.
You can also create multiple SQL views from the same source table, each tailored to a different reporting need. These views stay connected to the source data, so changes to the original table are reflected in the corresponding views.Smart Tables provides advanced table filtering, allowing users to filter rows and columns using different criteria.
Now, instead of reviewing every project task, stakeholders can focus on high-priority work that needs attention.
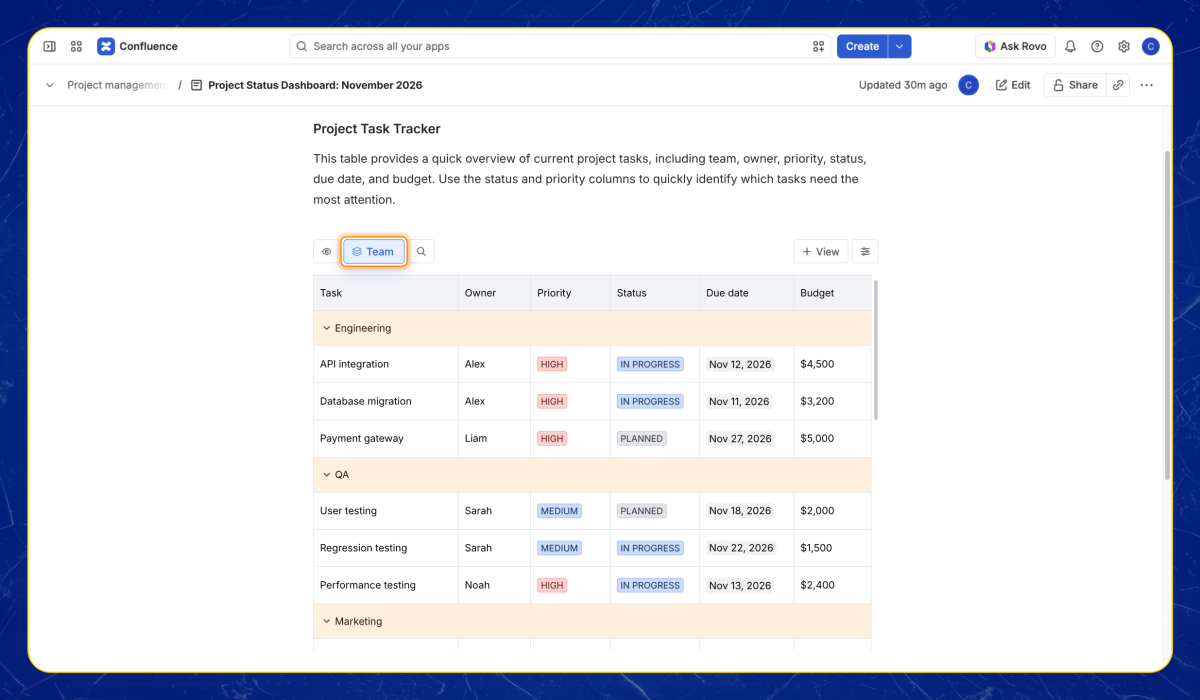
You can also group related records by team, owner, or another category to make large datasets easier to navigate.
Sorting and grouping are separate viewing modes in Smart Tables, so you can choose the one that best answers the question.
Step 4: Calculate project KPIs without exporting to Excel
Project reports frequently involve calculations.
A PMO might need to calculate total project budgets, compare estimated spending, or summarize costs across different teams.
Exporting the data into Excel every time a calculation is needed creates an extra step and potentially another version of the numbers.
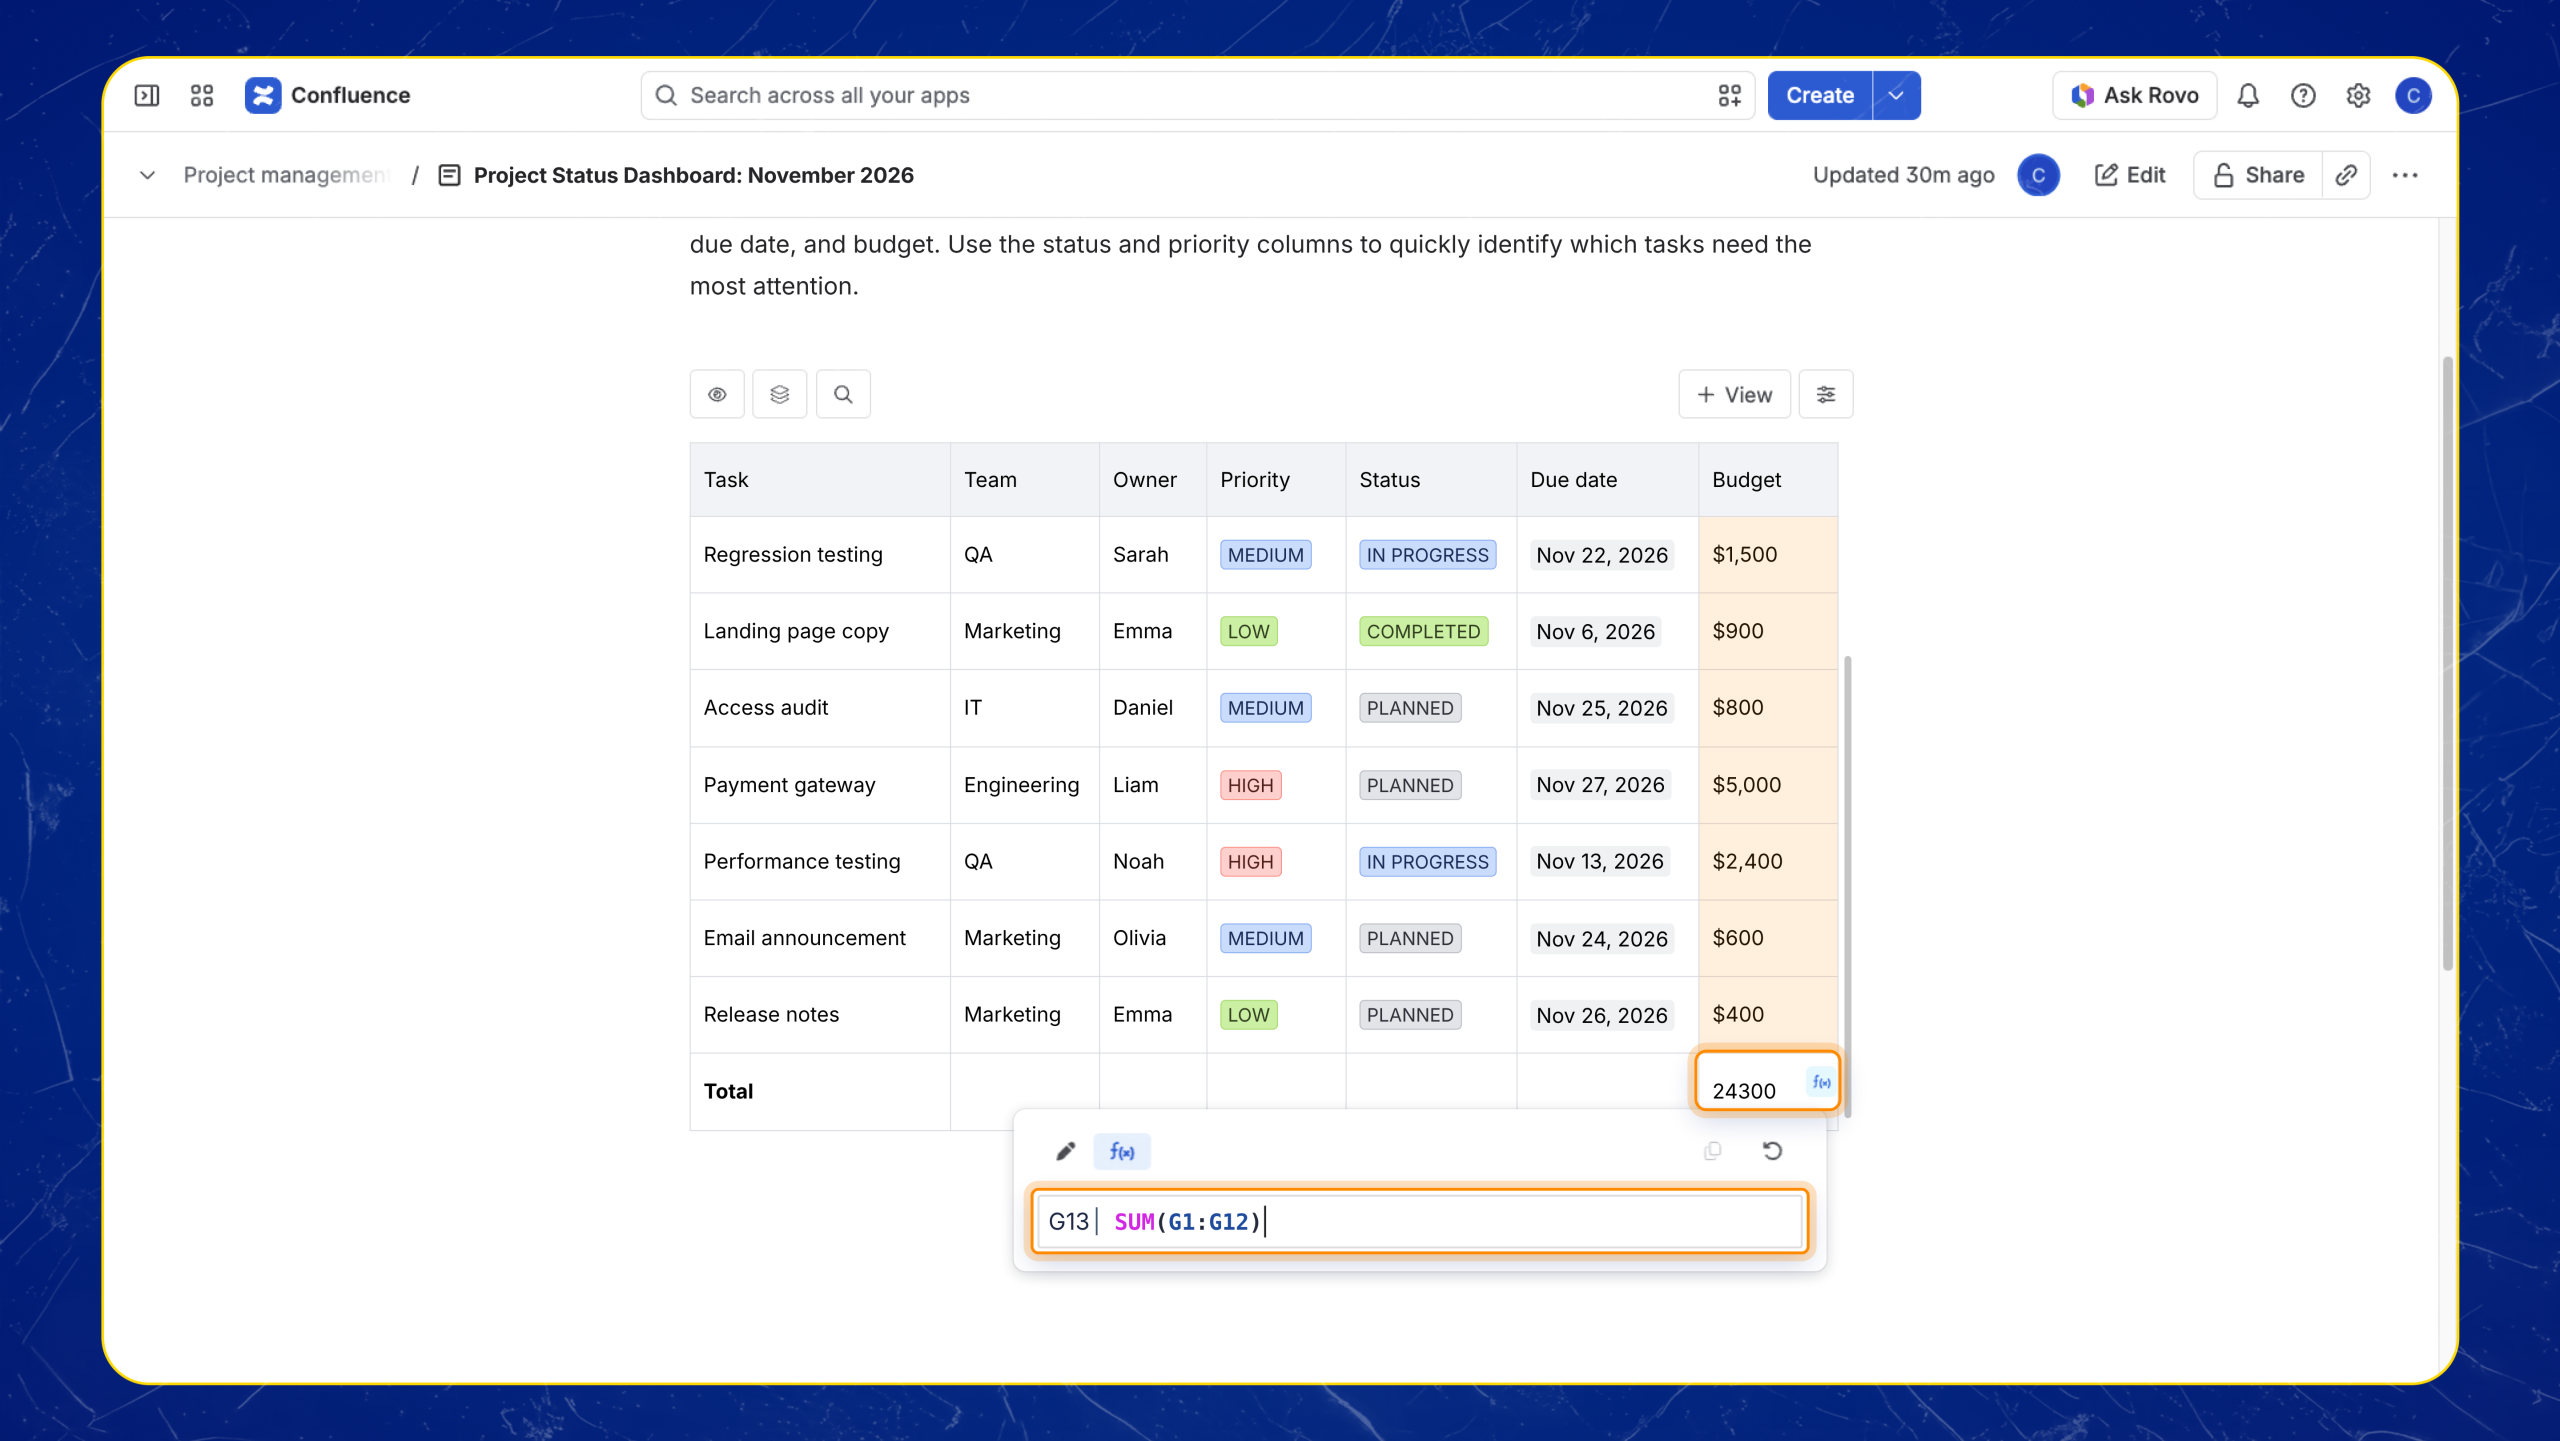
Smart Tables supports spreadsheet-style formulas, with more than 390 supported functions, allowing you to perform calculations directly in your Confluence tables.
For example, if your project tracker contains estimated and actual costs, you can add a Budget Variance column.
| Project | Planned budget | Actual spending | Variance |
|---|---|---|---|
| Website redesign | $12,000 | $10,500 | $1,500 |
| Mobile app release | $18,000 | $20,000 | -$2,000 |
| Customer portal | $8,000 | $7,200 | $800 |
In this example:
Budget variance = Planned budget − Actual spending
A positive variance means spending is below the planned budget. A negative variance indicates an overrun.
You can use Smart Tables formulas to calculate these differences and other metrics without maintaining a separate spreadsheet.
This is particularly useful when your project dashboard needs both descriptive context and numerical reporting.
Explore Smart Tables’ supported functions.
Step 5: Turn project tables into charts and pivot tables
Tables are useful for detailed reporting, but stakeholders often need a quick overview before exploring individual records.
For example, a PMO Director may want to see how many tasks each team has completed, or how project budgets are distributed across departments.
Instead of creating those summaries manually, Smart Tables lets you add charts and pivot tables to your data.
Use pivot tables to summarize project information
A pivot table helps you group and aggregate data.
For example, you could summarize tasks by team and status:
| Team | Completed | In progress | Planned |
|---|---|---|---|
| Engineering | 18 | 7 | 4 |
| QA | 12 | 5 | 3 |
| Marketing | 9 | 4 | 2 |
Instead of counting each task manually, the pivot table summarizes the information from the source dataset.
You can adjust the fields and aggregation rules to answer different reporting questions.
Use charts to visualize project progress
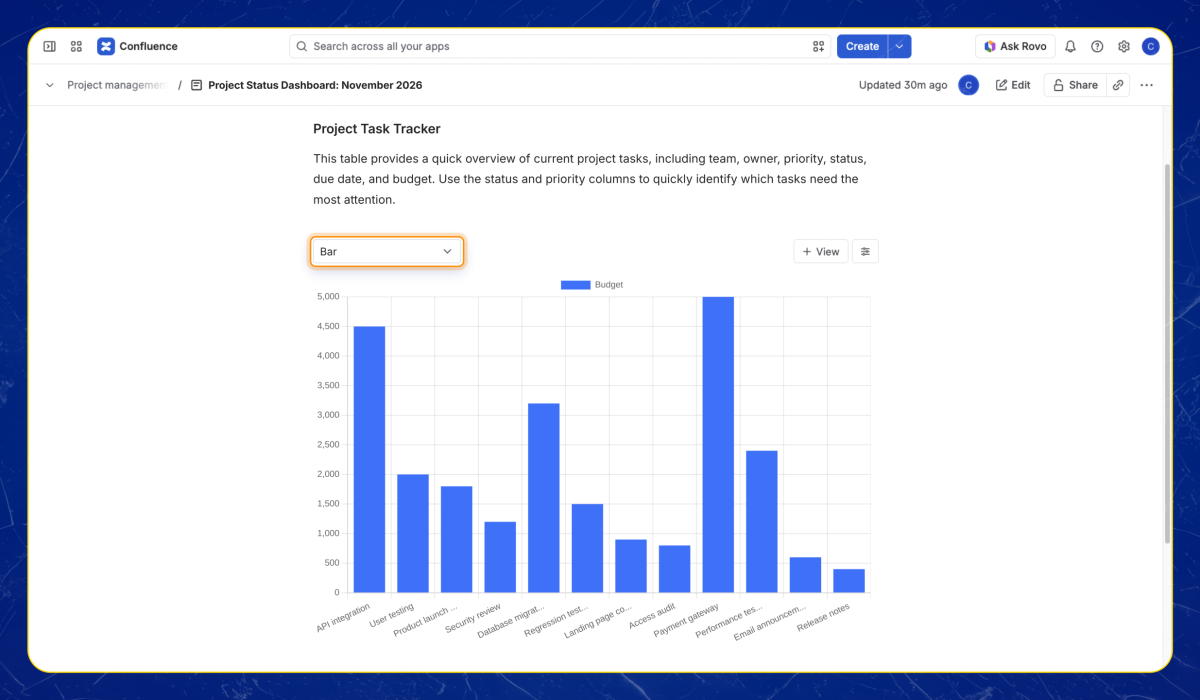
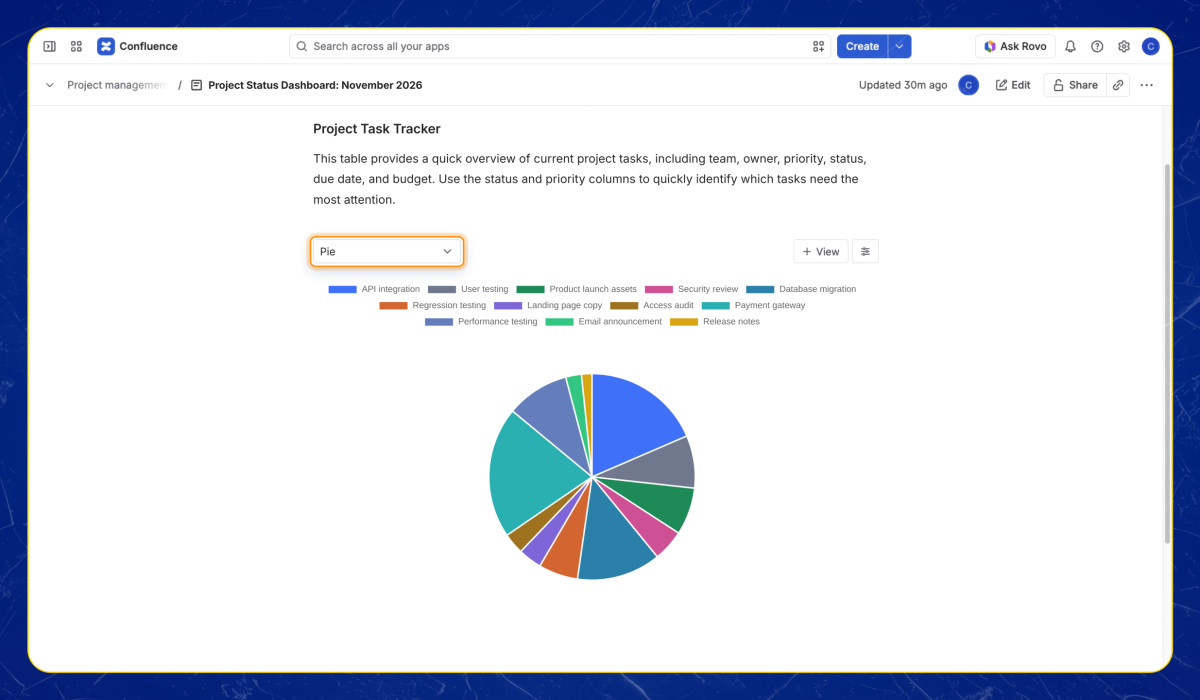
Smart Tables also supports different chart types, including bar, line, pie, and area charts.
For example:
- A bar chart can compare task counts across teams.
- A pie chart can display the distribution of task statuses.
- A line chart can represent project metrics recorded over time.
- A column-style bar chart can compare planned and actual budgets.
Smart Tables charts are connected to the displayed Smart Table data and update with relevant edits and filters.
This means you can maintain the source data and use connected visualizations rather than rebuilding charts for each reporting cycle.
Step 6: Build a project status page stakeholders can actually use
Now that your project information is structured, filtered, and visualized, bring it together on a Confluence reporting page.
A useful project status dashboard doesn’t need to contain every detail.
It should help stakeholders understand the current situation, explore relevant information, and identify decisions that need attention.
For example, your page could contain:
Project overview
- Project name and objective
- Project owner
- Reporting period
- Overall project health
Delivery progress
- Project task tracker
- Task status summary
- Upcoming milestones
Budget and resources
- Planned and actual budget
- Budget variance
- Workload distribution
Risks and next steps
- High-priority issues
- Key blockers
- Decisions required
- Next reporting actions
You can use Confluence for the narrative sections and Smart Tables for the structured data, calculations, charts, and pivot tables.
Smart Tables also supports multiple views within the same macro, allowing users to switch between a table, charts, and pivot tables.
These analytical views remain connected to their Smart Table source, helping reduce repeated report preparation when that data changes.
However, it’s important to distinguish this from Jira synchronization.
If you maintain project data directly in Smart Tables, the associated views use that data. Jira-connected reports or macros can separately display live Jira information in Confluence, but Smart Tables does not automatically import and synchronize all Jira issues.
How does Atlassian’s Teamwork Collection support project reporting?
A useful project dashboard fits into a broader project management workflow.
Atlassian’s Teamwork Collection connects tools that support planning, collaboration, documentation, and communication.
Each plays a different role:
- Jira: Track project tasks, delivery progress, issues, and workflows.
- Confluence: Document project plans, decisions, status updates, and stakeholder reporting.
- Loom: Record asynchronous project updates and explain important changes.
- Rovo: Help teams discover relevant project knowledge and summarize information from supported sources.
Smart Tables adds advanced table management and analytical capabilities to Confluence.
Project Managers can maintain structured project information, use formulas to calculate KPIs, and display different reporting views alongside their project documentation.
This helps keep project information and stakeholder context closer together without requiring every report to live in a separate spreadsheet.
From project trackers to useful stakeholder reporting
A project status dashboard should make reporting easier, not create another process to maintain.
If your project information already lives in Confluence, start by identifying the metrics stakeholders need most.
Build a structured tracking table, organize it with filters, add calculations where needed, and use charts or pivot tables to summarize the results.
Then bring those views together with the project context, decisions, and next steps that stakeholders need to understand.
You don’t need to recreate the same report every week. You need a reliable source of project data and useful ways to present it.
With Smart Tables for Confluence, you can turn structured project information into interactive reporting that helps teams monitor progress and make more informed decisions.
Try Smart Tables for Confluence on the Atlassian Marketplace or book a demo.
Frequently Asked Questions
Can I create a project dashboard in Confluence?
Yes. Confluence can host project status pages containing documentation, task information, progress reports, and charts. Smart Tables adds advanced filtering, calculations, pivot tables, and charts for structured project data maintained in Confluence.
How can I track project progress in Confluence?
You can use Confluence tables, project status templates, and Jira-connected reports. Smart Tables lets you build interactive trackers, filter tasks by status or owner, and create visual summaries from your table data.
Can Smart Tables automatically update project charts?
Yes. Smart Tables charts are connected to the displayed Smart Table data and update when the relevant data or filters change. This does not mean Smart Tables automatically synchronizes external Jira project information.
Can I create a PMO dashboard in Confluence?
Yes. A PMO dashboard can combine project status, timelines, financial information, workloads, and risks. Smart Tables can help summarize and visualize structured data using formulas, filters, charts, and pivot tables.
Can I calculate project budgets directly in Confluence?
Yes. Smart Tables supports spreadsheet-style formulas that let you calculate metrics such as total costs and budget variances directly in Confluence tables.
What’s the difference between Jira dashboards and Confluence project dashboards?
Jira dashboards focus primarily on information from Jira work items and projects. Confluence project dashboards can combine project documentation, commentary, decisions, and reporting. Smart Tables adds analytical capabilities for structured tables within Confluence.
Can I use existing Confluence tables with Smart Tables?
Yes. Smart Tables supports converting existing Confluence tables, creating new tables, and importing data from supported spreadsheet formats.